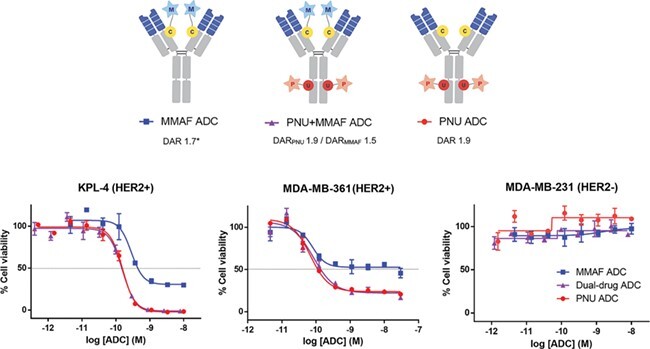
Figure 4 .

Cytotoxicity of single-drug and dual-drug ADCs. Cytotoxicity graphs for HER2+ BC cell lines KPL-4 and MDA-MB-361/DYT2, and HER2− BC cell line MDA-MB-231 (left to right). Mean ± SD values of triplicates were plotted. *An average DAR of single-MMAF ADC was determined by RP-HPLC.
