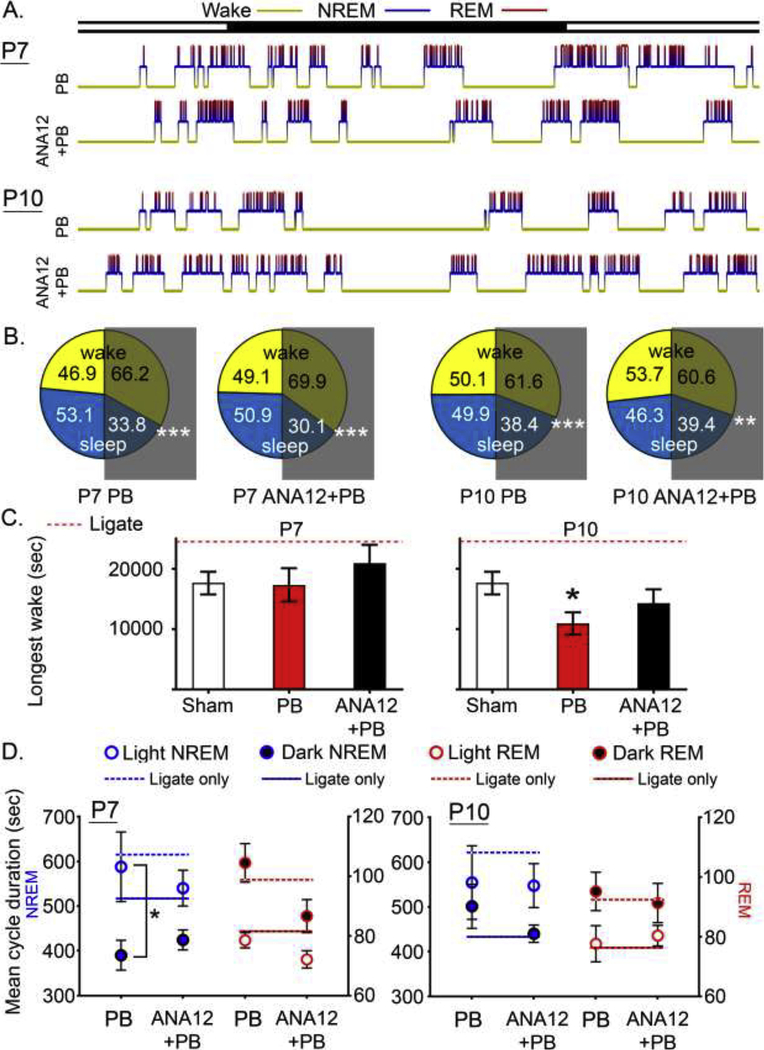
Figure 3. Sleep structure analyses.
A. Representative 24h hypnograms for each treatment group. B. Mean percentage of wake and sleep by light and dark cycle. All groups showed significantly higher percent wake vs. sleep (p<0.01; white asterisks). C. Longest wake cycle for each group. Ligates (untreated and treated ligates) exhibited significantly longer duration of longest wake, and this was reversed in all groups, resulting in loss of statistical significances. P10 PB-alone group had a significantly shorter duration of longest wake compared to sham (p=0.047, One-way ANOVA). D. Mean cycle duration of NREM and REM by light and dark cycle. Age-matched untreated ligate-controls are shown in line (dotted for light and solid for dark) for comparison. Asterisk denotes within-group NREM diurnal variation (light vs. dark).

