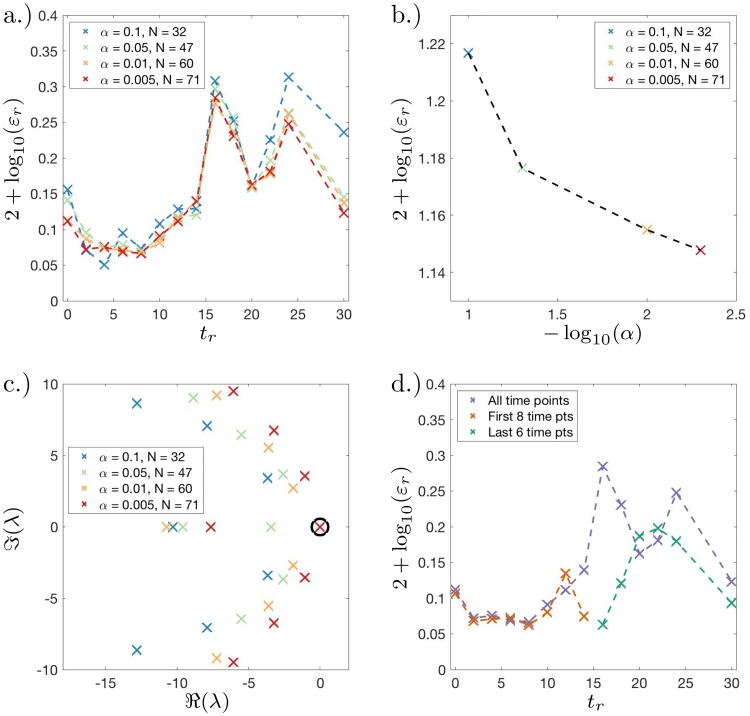
Fig 5. Dynamic distribution decomposition applied to Nanog-Neo cell line data taken from Zunder et. al. [28].
(a.) Fitting error plot showing log10 transformed percentage error plotted against time for different values of α (described in main text); (b.) log-log plot of mean fitting error plotted against −log10(α), mean error decreases as alpha decreases; (c.) complex plot of eigenvalues λ of Perron–Frobenius matrix P for different values of α; (d.) Fitting error plot showing log10 transformed percentage error plotted against time for α = 0.05 (mean error 14.1%), two further Perron–Frobenius matrices are fitted using only the: first 8 time points (mean error 8.4%); and last 6 time points (mean error 14.0%).

