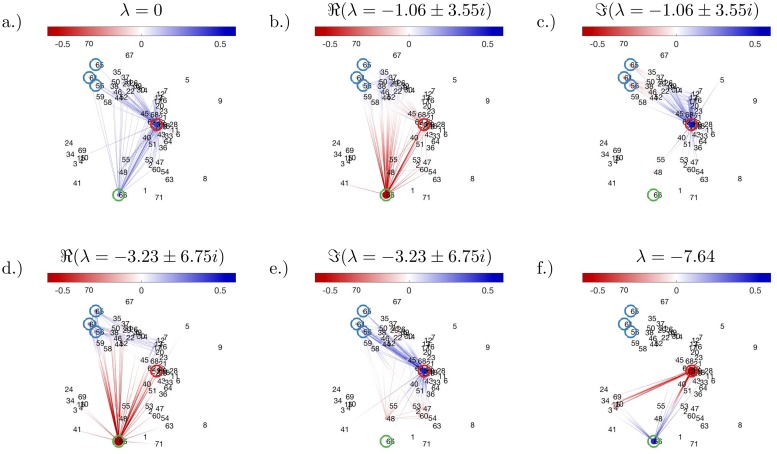
Fig 6. Dynamic distribution decomposition applied to Nanog-Neo cell line data taken from Zunder et. al. [28].
Plots (a)–(f) show a graph representation of the eigenfunctions, for full details see Methods section. Groups as defined in the text are circled and coloured in: red (group A, MEF-like); blue (group B, mesendoderm); and green (group C, ESC-like).

