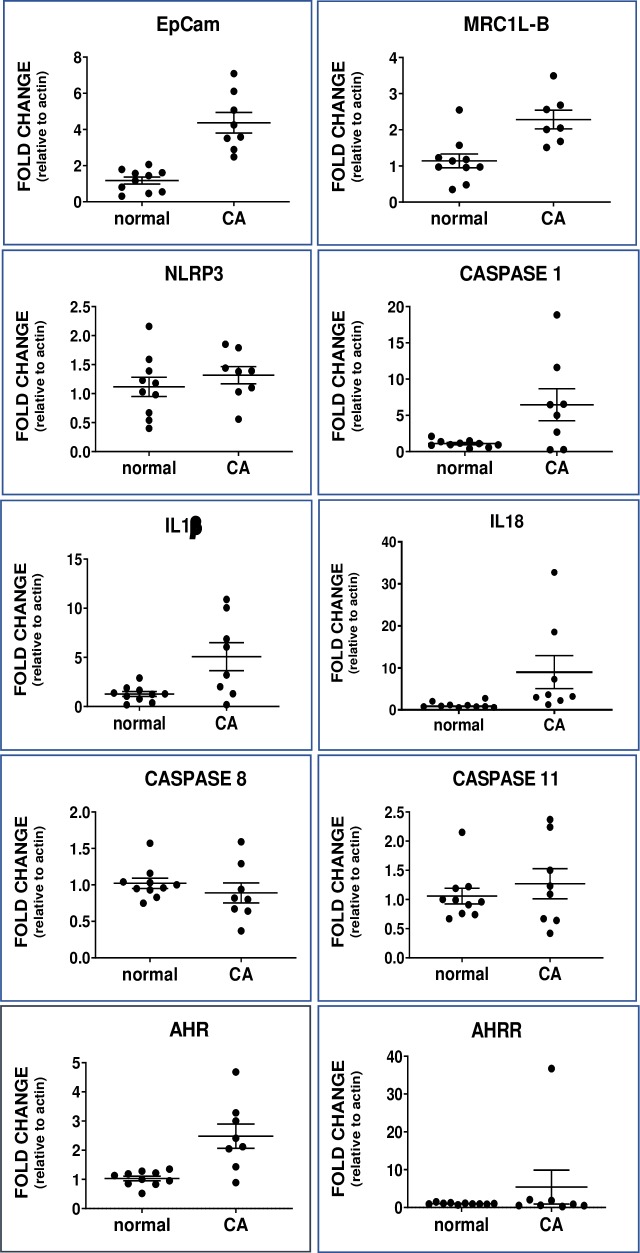
Fig 3. Dot plot of mRNA levels in hen normal ovary (normal) and ovarian cancer (CA).
EpCAM, a proliferation marker, differed significantly (p<0.001). MRC1L-B, a marker for macrophages, differed significantly (p = 0.002). The difference between mRNA of inflammasome components differed significantly for caspase-1 (CASP1) (p = 0.04), IL1β (p = 0.04) and IL18 (p = 0.003) but not NLRP3 (p = 0.3) between normal and cancer ovaries; other caspase mRNAs caspase-8 (CASP8) (p = 0.17) and caspase-11 (CASP11) (p = 0.65) did not differ. AHR (p = 0.002) but not AHRR (p = 0.5) mRNA expression differed between normal and cancer ovaries. Note: Y-axis range differs among graphs; values are mean fold change relative to actin ± SEM.

