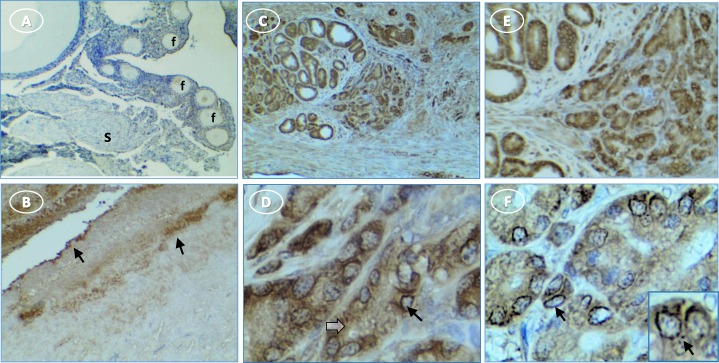
Fig 7. More caspase-1 is expressed in hen ovary with tumors than in normal ovary.
(A) normal ovary without stain in follicles (f) or stroma (s); (B) normal ovary shows surface epithelium (arrow) staining; (C, E) intense stain in cords of tumor cells; (D, F) higher magnification shows perinuclear (arrow) and diffuse cytoplasmic stain (white arrow) [inset, punctate perinuclear stain (arrow)]. Original magnification: (A) 4X; (B) 4X; (C) 4X; (D) 40X; (E) 4X; (F) 40X [inset, 60X].

