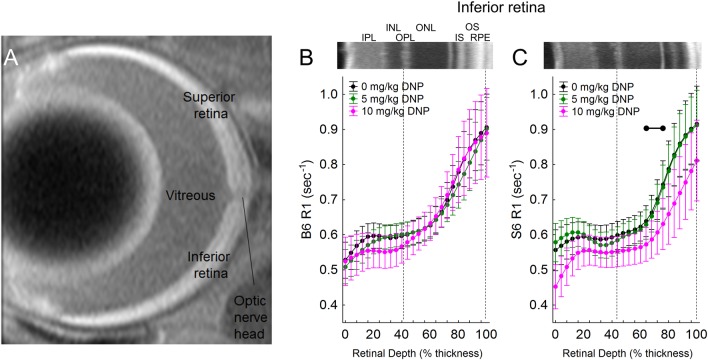
Fig 3.
A) Representative high spatial resolution T1-weighted MRI. The retina shows a distinctive 4-layer pattern (bright, dark, bright, dark) on MRI, as previously reported; the anatomic identity of each dark / bright band has not been fully characterized [38]. The vitreous-retina and retina-choroid borders are visibly evident used as the only fiduciary alignment regions for comparing MRI and OCT data. MRI R1 profiles. Modeling results are shown for 1/T1 MRI profiles in vivo ~1 hr post DNP in inferior retina of dark-adapted. B) R1 vs depth (% of retinal thickness) for B6 mice after injection of either saline (0 mg/kg, black, n = 6), 5 mg/kg DNP (green, n = 10), or 10 mg/kg DNP (pink, n = 5), and C) R1 vs depth (% of retinal thickness) for S6 mice after injection of either saline (0 mg/kg, black, n = 7), 5 mg/kg DNP (green, n = 8), or 10 mg/kg DNP (pink, n = 10). Representative OCT images from inferior retina of B6 and S6 mice are presented above the profiles. Each 1/T1 data set was normalized to its TR 150 ms image (“Normalized 1/T1”), as detailed in the Methods section. OCT layer assignments (IPL, inner plexiform layer; INL, inner nuclear layer; OPL, outer plexiform layer; ONL, outer nuclear layer; IS, rod inner segment layer; OS, rod outer segment layer; RPE, retinal pigment epithelium) are as previously published [37]. Approximate location of two anatomic landmarks are indicated by dashed, vertical lines (i.e., anterior aspect of the OPL [left] and retina/choroid border [right]). Black range bar: Retinal depth range with significant difference (p < 0.05). Error bars represent 95% confidence intervals.

