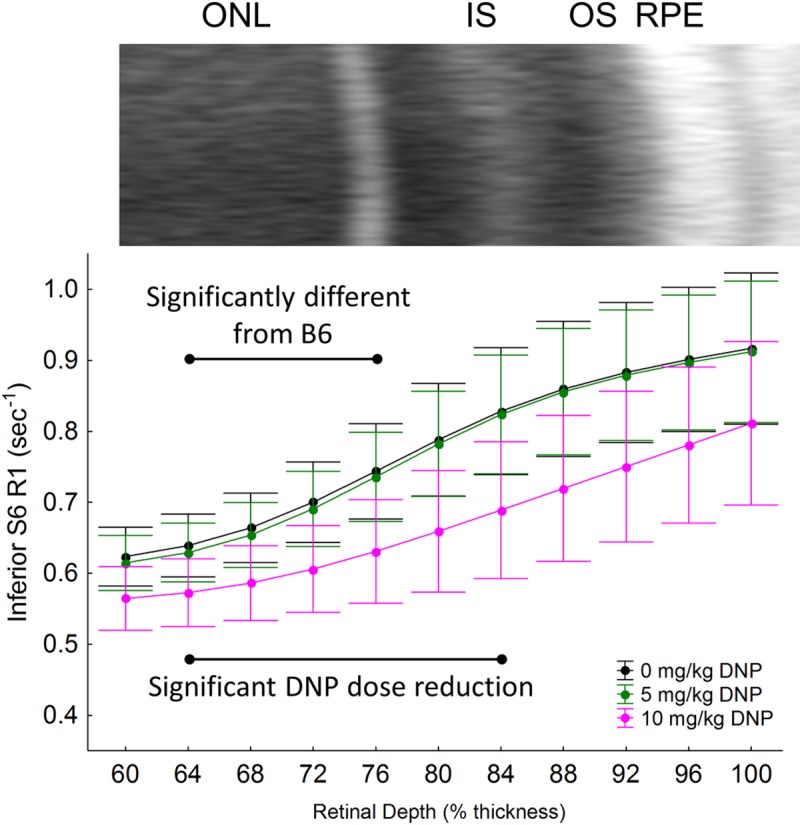
Fig 4.

To highlight the localized differences in inferior retina of S6 mice, modeling results are replotted on an expanded scale for 1/T1 MRI profiles in vivo ~1 hr post DNP in inferior retina of dark-adapted mice after injection of either saline (0 mg/kg, black, n = 7), 5 mg/kg DNP (green, n = 8), or 10 mg/kg DNP (pink, n = 10). An expanded region of the representative OCT image from inferior retina of S6 mice is also shown above the profiles. Other conventions are as in Fig 4 and its legend. Black range bar: Retinal depth range with significant differences (p < 0.05) as indicated. Error bars represent 95% confidence intervals.
