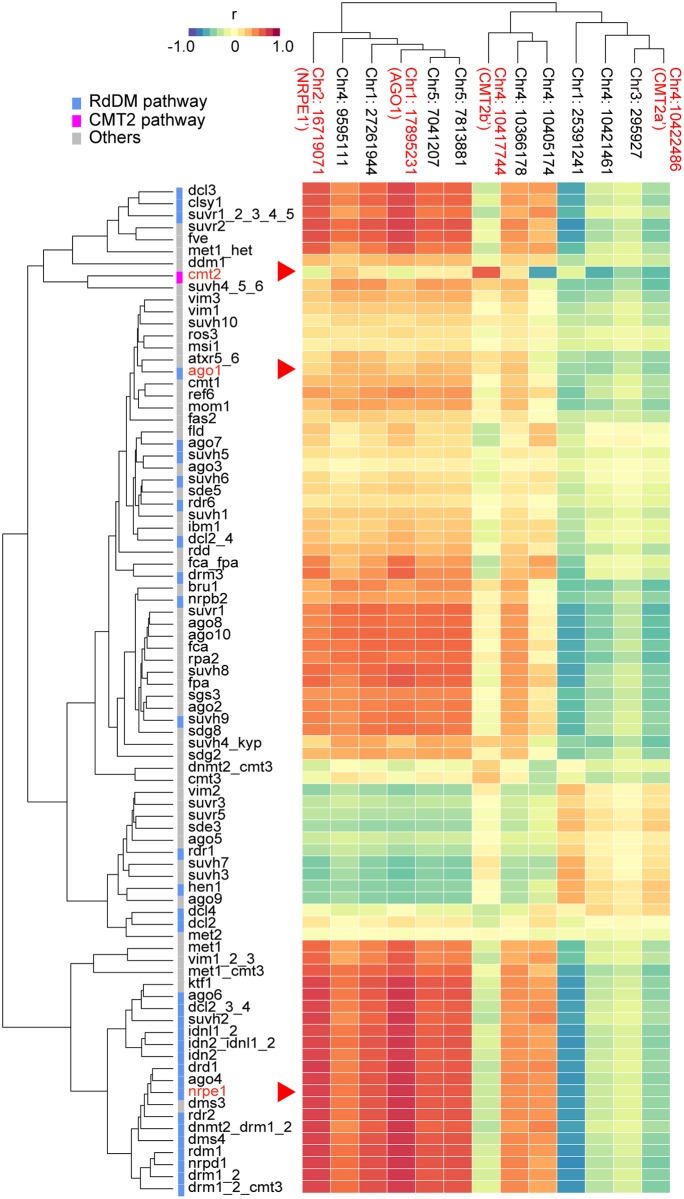
Fig 4. Comparison of the effects of mCHH variation associated with 13 natural alleles to variation induced by knocking out 86 different genes involved in DNA methylation.
The heat map shows Spearman’s correlation coefficients between SNP- and mutant-associated DMLs across 9,228 TEs. Both rows (mutants [13]) and columns (SNPs found in GWAS; see Fig 1, S2 and S3 Tables) have been clustered by similarity in DML pattern.

