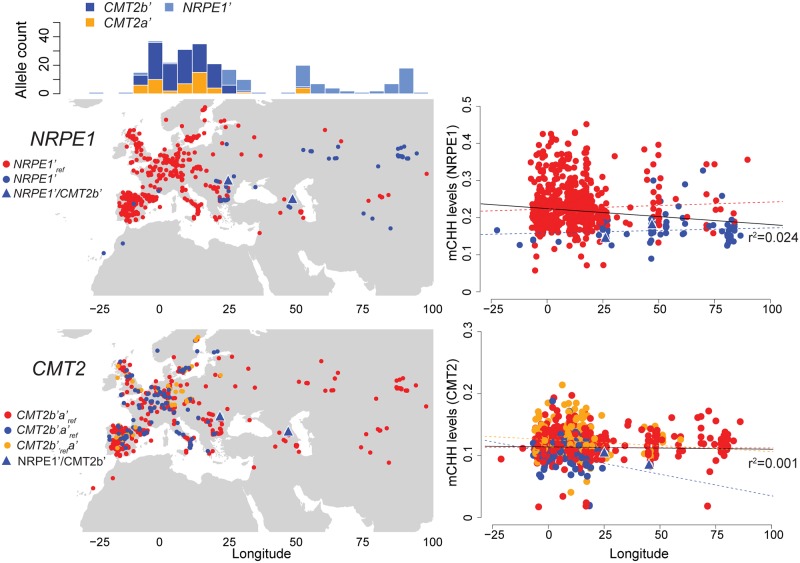
Fig 6. Geographical distribution of NRPE1 and CMT2 alleles, and longitudinal mCHH variation.
Maps on the left show the distribution of NRPE1’, CMT2b’, and CMT2a’ alleles, and the frequency of non-reference alleles along to longitude. Plots on the right show average mCHH levels of NRPE1- and CMT2-targeted TEs as a function of longitude. mCHH levels are average of NRPE1’ and CMT2b’-targeted TEs. Colors of regression lines correspond to alleles; the black lines correspond to all lines.

