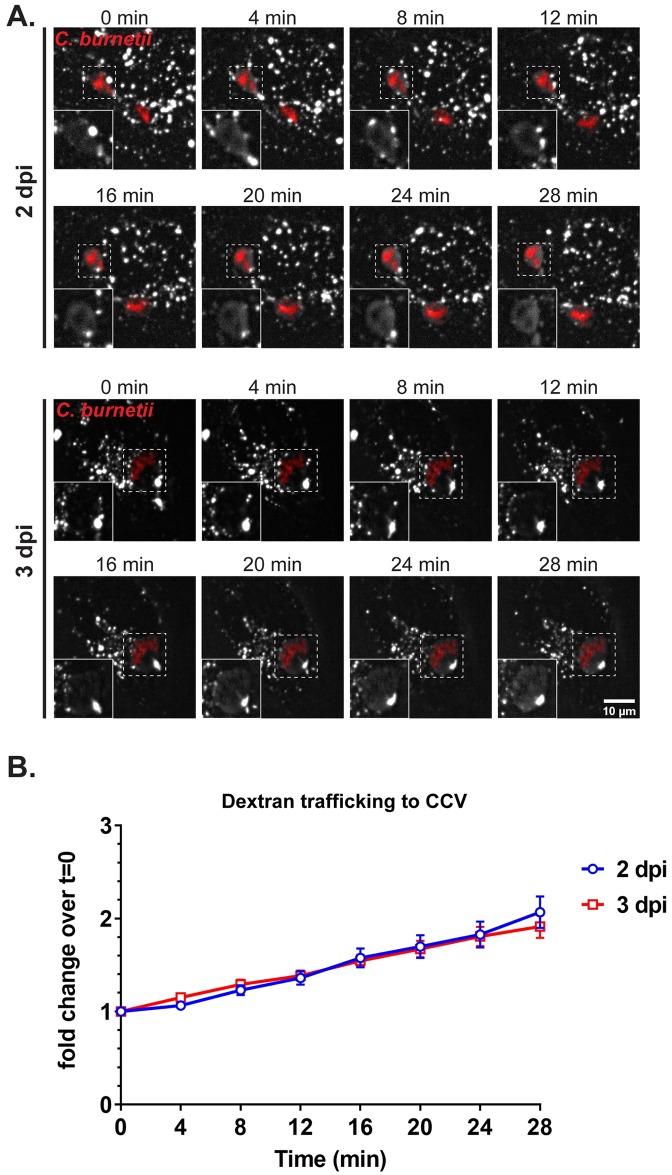
Fig 5. CCV fusogenicity does not increase from 2 to 3 days post infection.
(A) Fluorescent dextran trafficking to CCV at 2 and 3 dpi. mCherry-expressing WT C. burnetii-infected HeLa cells were pulsed with Alexa 488 dextran for 10 min followed by live-cell spinning disc confocal microscopy, where the cells were imaged at 0 min post-pulse, and then every 4 min for 28 min. Images were processed identically in ImageJ; white = dextran, red = C. burnetii; Dextran in CCVs (boxed) shown in insets. (B) Quantification of dextran intensity in CCV revealed no significant difference in dextran trafficking to the CCV between 2 and 3 dpi. Fluorescent intensity of Alexa 488 dextran was measured from an identical region of interest (ROI) within the CCV at each time point. The mean fold change of fluorescent intensity over initial time point (t = 0) was plotted against time. Data shown as the mean±SEM of fluorescent intensity fold change from at least 15 CCVs per condition in each of three independent experiments as analyzed by multiple t-test.

