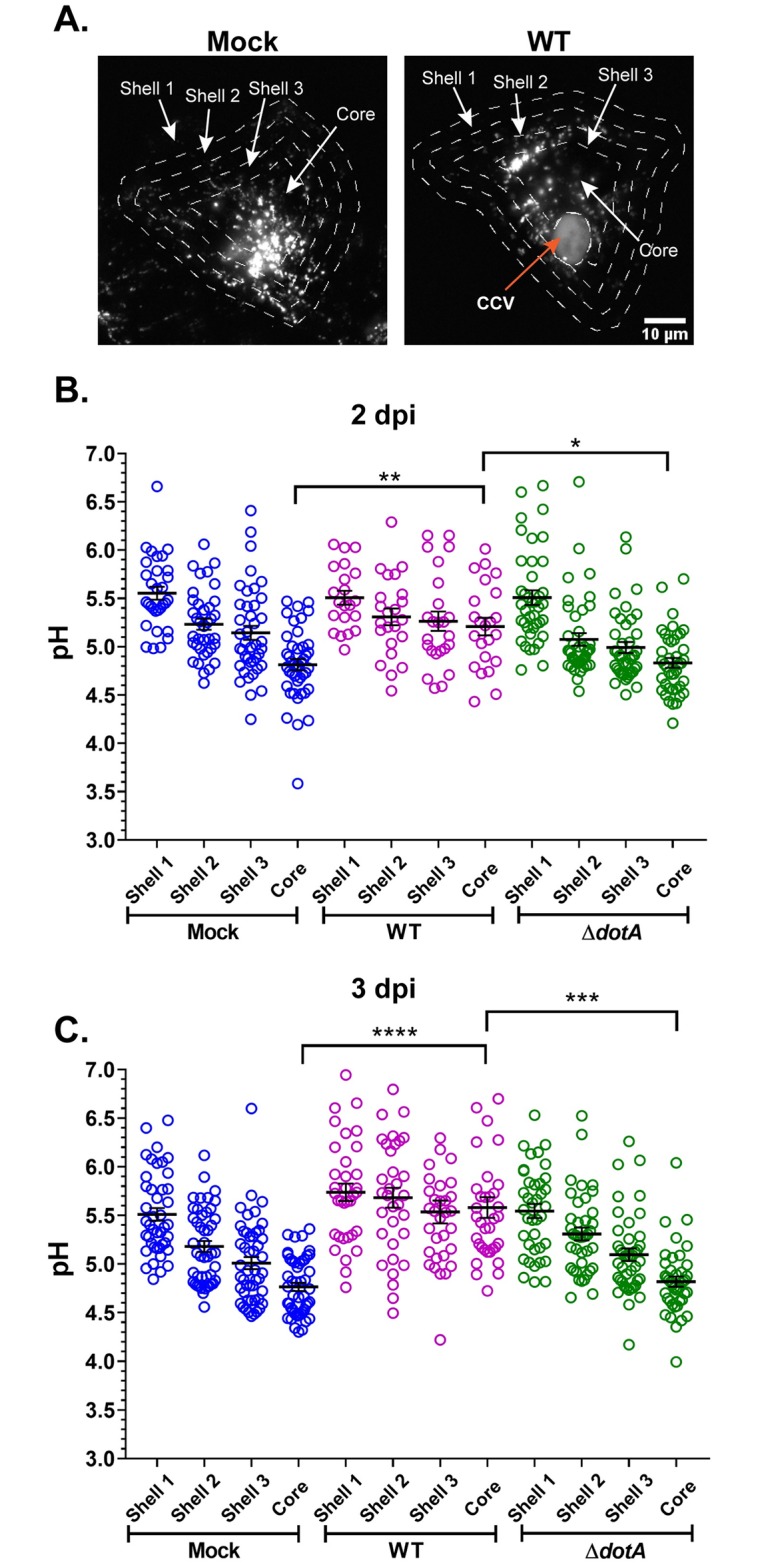
Fig 7. C. burnetii T4BSS inhibits progressive endosomal acidification.

(A) Representative images of mock, mCherry WT and mCherry ΔdotA-infected Hela cells pulsed with Oregon Green 488 and Alexa 647 dextran for 4 h followed by a 1 h chase for endosomal maturation. Live-cell spinning-disc microscopy images were processed identically in ImageJ. To generate concentric shells corresponding to peripheral, perinuclear, and intermediate zones, an ROI at the cell periphery was degraded 3 times, 4 um each time. In C. burnetii-infected cells the CCV was excluded from measurements. (B, C) Ratiometric pH analysis revealed that the mature endosomes at the perinuclear area (core) of the WT-infected cells were significantly less acidic compared to those in the mock and ΔdotA-infected cells at both 2 and 3 dpi. Each circle represents an individual cell. Data shown as mean±SEM of at least 15 cells per condition in each of three independent experiments as analyzed by one-way ANOVA with Tukey’s posthoc test; ****, P<0.0001; ***, P<0.001; **, P<0.01; *, P<0.05.
