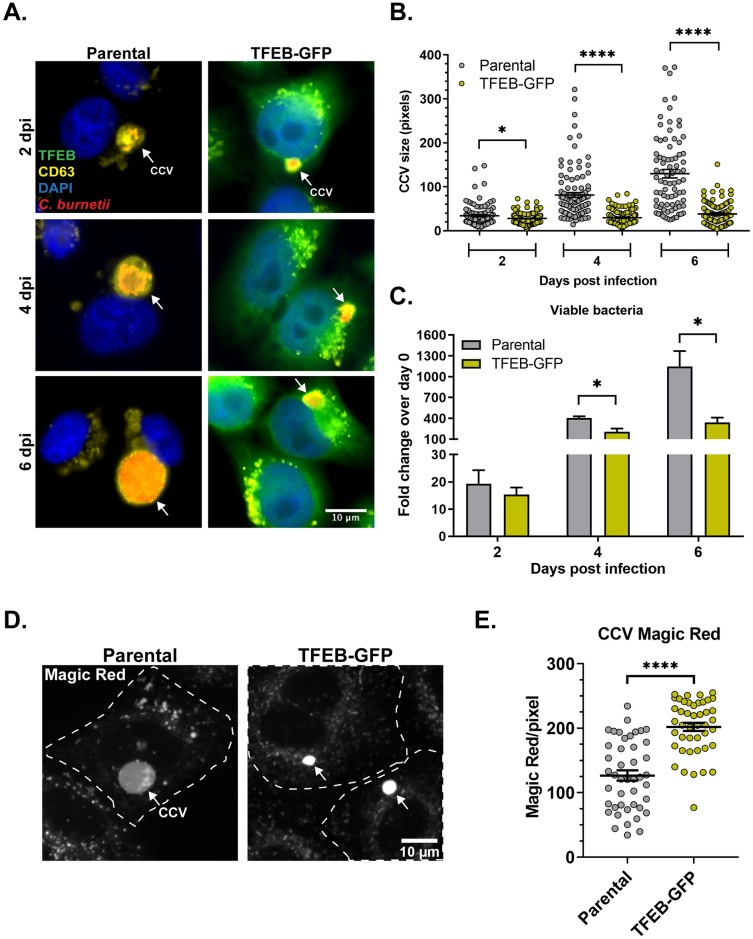
Fig 9. TFEB-induced lysosome biogenesis inhibits C. burnetii growth.
(A) Representative images of immunofluorescence staining of WT C. burnetii-infected parental and TFEB-GFP HeLa cells. Fixed cells were stained for C. burnetii and CD63, a CCV marker. Arrows point to individual CCVs. Qualitatively, TFEB-GFP cells contained smaller and fewer CCVs compared to parental cells. (B) Quantitation of CCV size in parental and TFEB-GFP cells revealed significantly smaller CCVs in TFEB-GFP cells compared to parental cells at all time points. Each circle represents an individual CCV. Data shown as mean±SEM of at least 30 CCVs per condition in each of three independent experiments as analyzed by unpaired student t-test; *, P<0.05; ****, P<0.0001. (C) Quantitative CFU assay revealed a significant reduction in bacterial growth in TFEB-GFP cells compared to parental cells. C. burnetii growth is plotted as a fold change of CFU/mL over 0 dpi at each time point. Data shown as mean±SEM from three independent experiments as analyzed by multiple t-test; *, P < .05. (D) Representative images of Magic Red staining of WT C. burnetii-infected parental and TFEB-GFP HeLa cells at 3 dpi. WT C. burnetii-infected cells were plated on ibidi slides and labeled with cathepsin B Magic Red for 30 min followed by confocal microscopy. Arrows point to CCVs. (E) Quantitation of cathepsin B Magic Red in the CCV lumen at 3 dpi revealed a significant increase in cathepsin B activity in CCVs in TFEB-GFP cells, compared to control parental cells. To account for differences in CCV size, Magic Red intensity in the CCV lumen was normalized to CCV area. Each circle represents an individual CCV. Data shown as mean±SEM of at least 15 CCVs per condition in each of three independent experiments as analyzed by unpaired student t-test; ****, P<0.0001.

