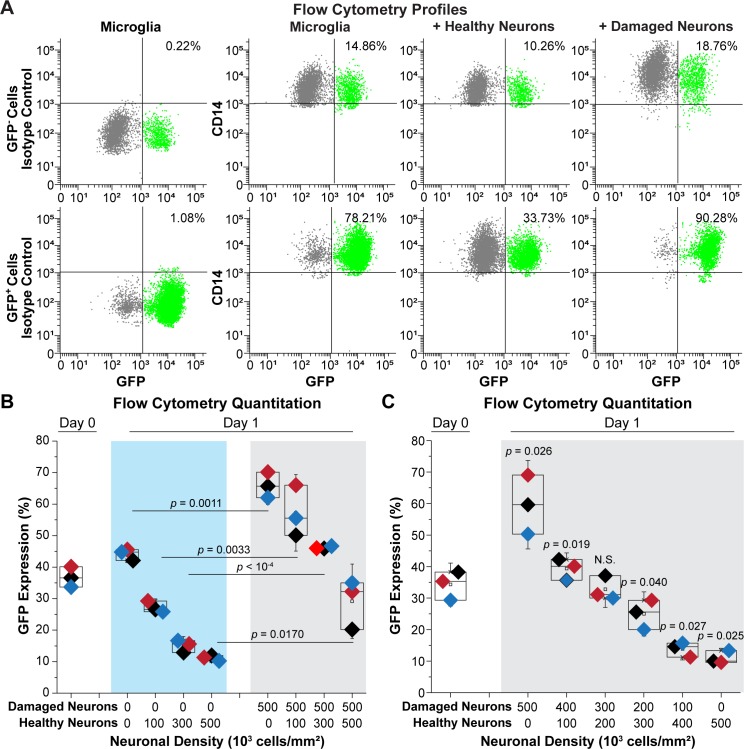
Fig 7. Effect of healthy neurons vs. damaged neurons on HIV expression.
(A) Representative flow cytometry profiles. hμglia/HIV HC69 cells were sorted into GFP- and GFP+ cells. Each population was expanded for 48 h prior to collection and co-cultured with either healthy neurons or damaged neurons at a ratio of 50:6. GFP (X-axis) and CD14 (Y-axis) expression, and the percentage of GFP+ cells that were CD14+ is shown. Isotype controls for the anti-CD14 antibody were performed for both the GFP+ and GFP- populations (left). (B) Quantitation of GFP expression. 60 x 103 HC69 cells were co-cultured in the presence of an increasing number of healthy (H) neurons in the absence damaged (H) neurons (X-axis) for 24 h prior to measuring GFP expression (Y-axis) (left). In parallel experiments, microglial cells were co-cultured with increasing numbers of healthy (H) neurons in the presence of 500 x 103 damaged (D) neurons (right). (C) Quantitation of GFP expression. 60 x 103 HC69 cells were co-cultured in the presence of 500 x 103 total neurons at the indicated ratios of damaged (D) to healthy (H) neurons (X-axis) for 24 h prior to measuring GFP expression (Y-axis). Diamonds of similar color represent an individual experimental series. (n = number of individual samples). The p-values of paired-sample t-tests comparing the unexposed vs. exposed cells are shown. N.S.; non-significant.

