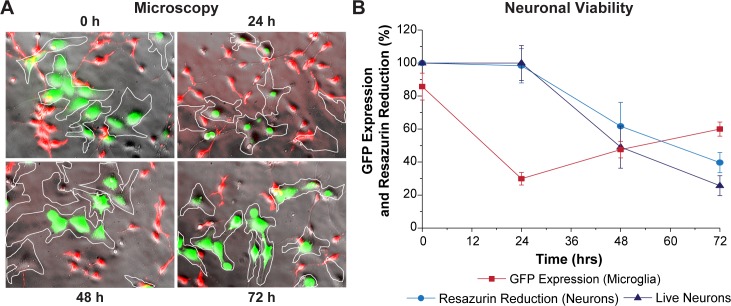
Fig 8. HIV expression rebounds in microglia exposed to neurons.
(A) Super-imposed phase contrast and fluorescence images of HC69 GFP+ cells exposed to neurons for 24, 72, or 96 h. Microglial cells are outlined by the white contours. (B) Quantitation of GFP expression (red), relative resazurin reduction (blue), and relative live neuron counts (purple), Y-axis, vs. Time, X-axis. Error bars: standard deviation (n = 3).

