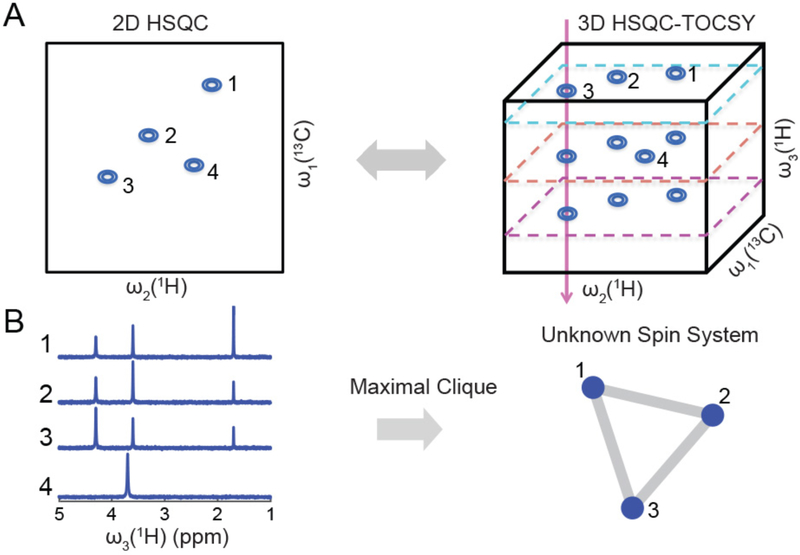
Figure 2.
Extraction of spin systems of individual mixture compounds from the 3D 13C-1H HSQC-TOCSY. Panel (A) shows the relationship between cross-peaks from the 2D 13C-1H HSQC spectrum (left) and the 3D 13C-1H HSQC-TOCSY spectrum (right). Panel (B) illustrates how 1D cross sections along ω3 (1H) of the 3D HSQC-TOCSY spectrum of (A) yield spin system information, which is extracted by use of a maximal clique approach. Traces 1, 2, 3 show high similarity because they belong to the same spin system consisting of three protons, whereas trace 4 belongs to a separate spin system with a single proton. Figure adapted with permission from Wang et al., 2017.

