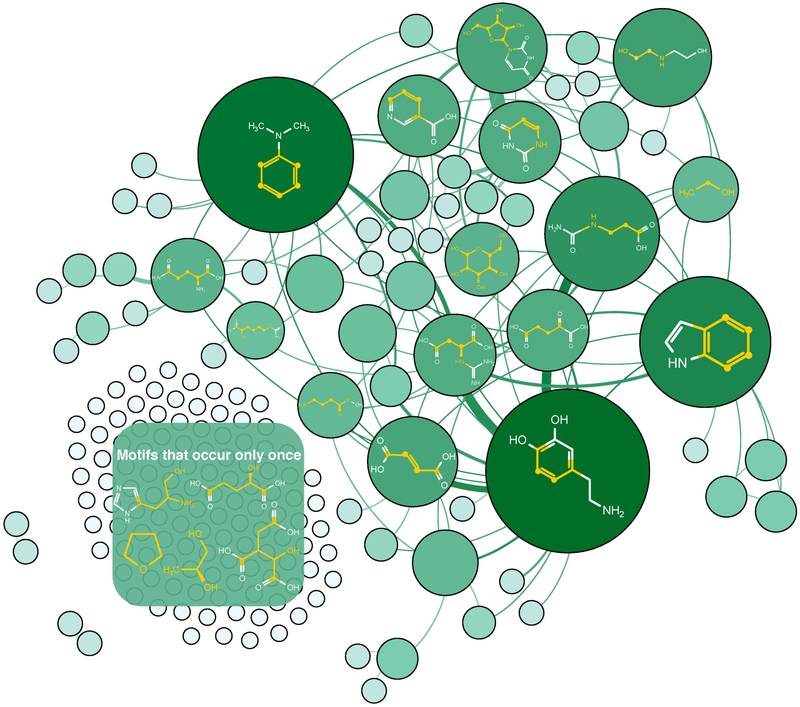
Figure 4.
Graph-theoretical representation of molecular motif clustering of current COLMAR MSMMDB molecules. Each node denotes a molecular motif where the node area is proportional to the number of molecules in the motif. For molecules containing two molecular motifs, their nodes are connected by an edge. The edge thickness (weight) is proportional to the number of molecules that contain both motifs. Representative molecular structures of some of the most abundant molecular motifs are depicted in the graph, and the spin system backbone is highlighted in yellow.

