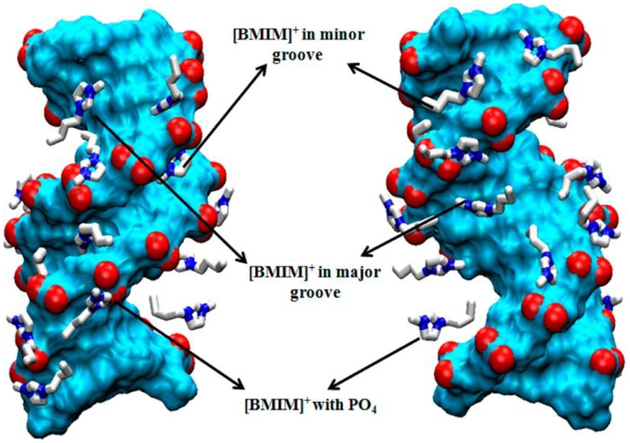
Fig. 2.
Typical spatial distribution map of [BMIM]+ cations illustrating their association with the DNA backbone, major groove, and minor groove (color scheme: cyan, DNA; red, DNA phosphates; white, IL cations; blue, ring nitrogens of the [BMIM]+ cations) (Reprinted with permission from Ref,61 Copyright © 2012 American Chemical Society).

