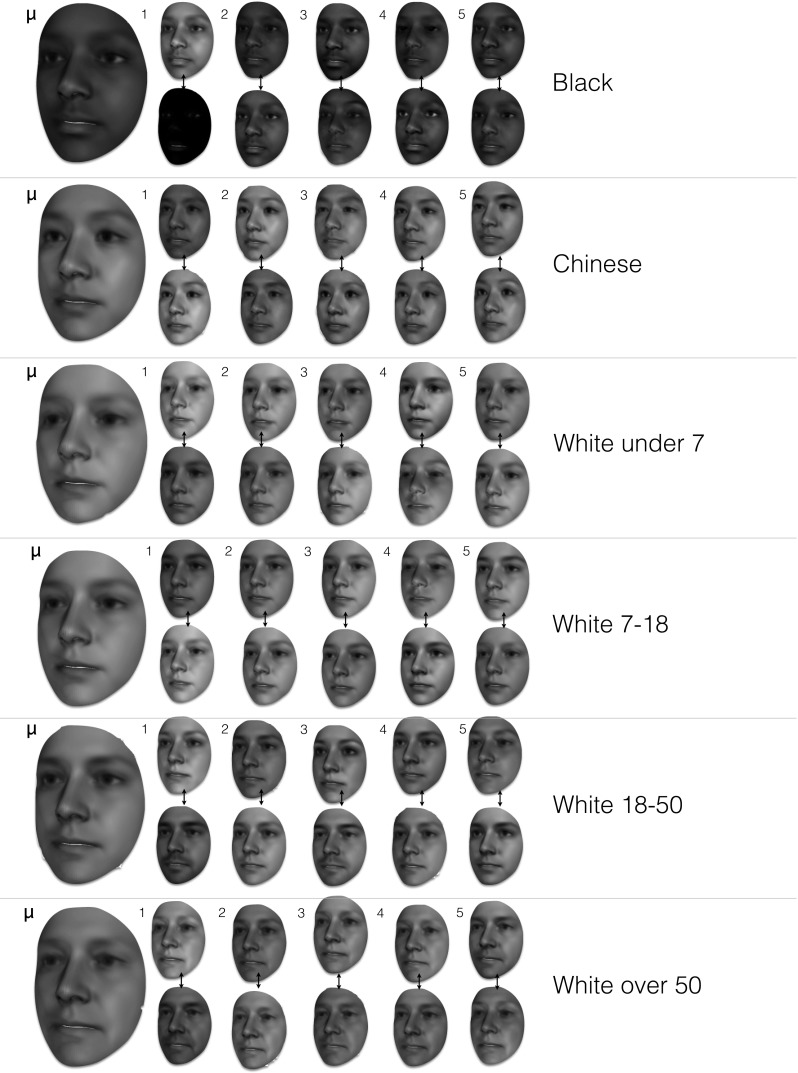
Fig. 10.

Bespoke texture models produced for specific subsets of the MeIn3D dataset. For each bespoke model, the figure shows the mean texture as well as the first five texture eigenvectors, each visualized as additions and subtractions away from the mean. In more detail, the top (bottom) row corresponds to deviating from in the direction of the corresponding texture eigenvector, with a weight of 3 (), where is the standard deviation of the corresponding component. All textures are visualized on the mean 3D shape
