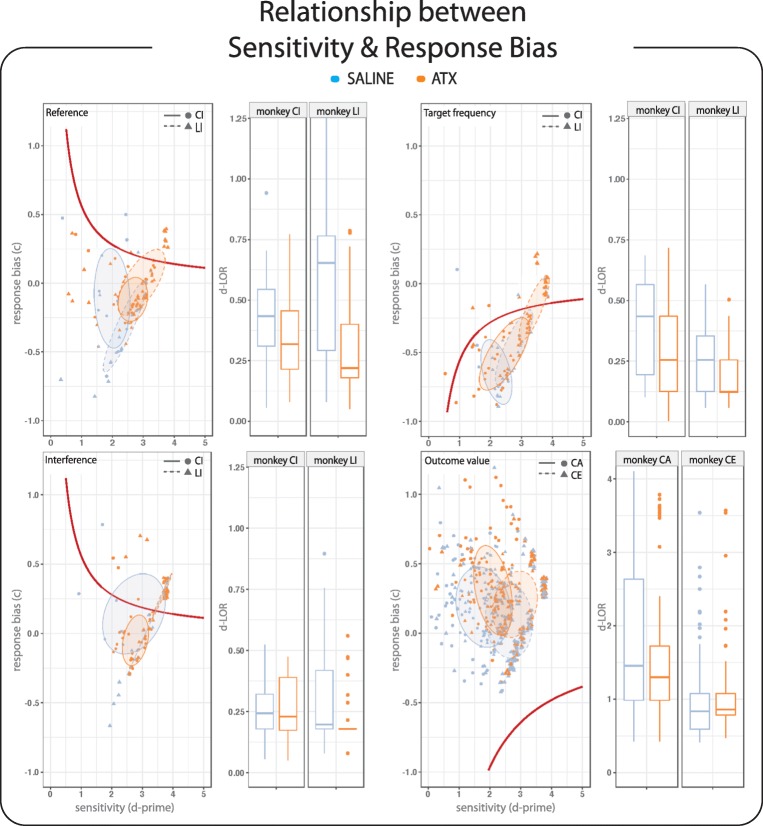
Fig. 3.
ATX effect on the distance to the line of optimal response (LOR)—Plots illustrating the relationship between sensitivity and response bias are depicted on the left. The red line represents the LOR for each task contrast, which depends on both the target frequency and the outcome values of the task. Each dot represents the average d-prime and c values for each block of a given task contrast and pharmacological condition (blue = saline and orange = ATX 0.5 mg/kg) for monkeys CI, CA (circles) and monkeys LI, CE (triangles). The ellipses surrounding the dots were drawn using a confidence level of 0.5. Adjacent boxplots on the right display the Euclidean distance to the LOR in each monkey and task contrast, in blue and orange, respectively for the saline (control) and ATX 0.5 mg/kg conditions

