. 2020 Jan 2;9:e50556. doi: 10.7554/eLife.50556

Figure 2. Inhibition of the CDK Pef1 in mis4-367 increased Rad21 binding to S phase chromosomes.

(A) Scheme of the experiment. Hydroxyurea (HU) was added to 12 mM at the time of the temperature shift along with 1-NA-PP1 or solvent alone (DMSO). Cells were collected after 4.25 hr. The S phase arrest was confirmed by DNA content analysis (Figure 2—figure supplement 1). (B) Schematics showing the loci analyzed by ChIP-qPCR. (C) The effect of 1-NA-PP1 treatment on Pef1-as is shown by the ratio 1-NA-PP1/DMSO (red) for each site analyzed. The ratios in a pef1+ background (blue) estimate the off target effects of the inhibitor. Ratios were calculated from the ChIP data shown in Figure 2—figure supplement 1. Bars indicate mean ± SD from four ratios. ***p≤0.001, **p≤0.01, *p≤0.05, by two-tailed, unpaired t-test with 95% confidence interval (Figure 2—source data 1). (D) Rad21 binding relative to wild-type. The ratios highlight the recovery of Rad21 binding upon inhibition of the CDK relative to wild-type levels. Ratios were calculated from the data shown in Figure 2—figure supplement 1. Bars indicate mean ± SD from four ratios. **p≤0.01, *p≤0.05, by two-tailed, unpaired t-test with 95% confidence interval (Figure 2—source data 1). (E) Cell growth assay showing that pef1Δ does not suppress mis4-367 thermosensitive phenotype in the absence of the swi6 gene.

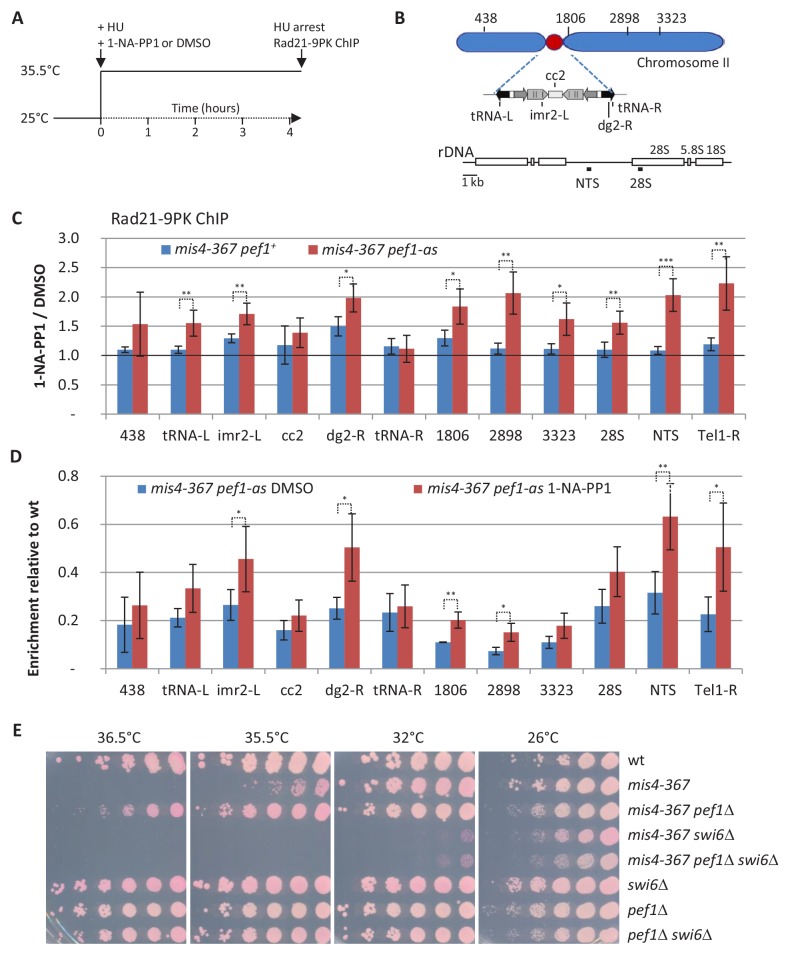
Figure 2—source data 1. Raw ChIP data and t-tests.

Figure 2.

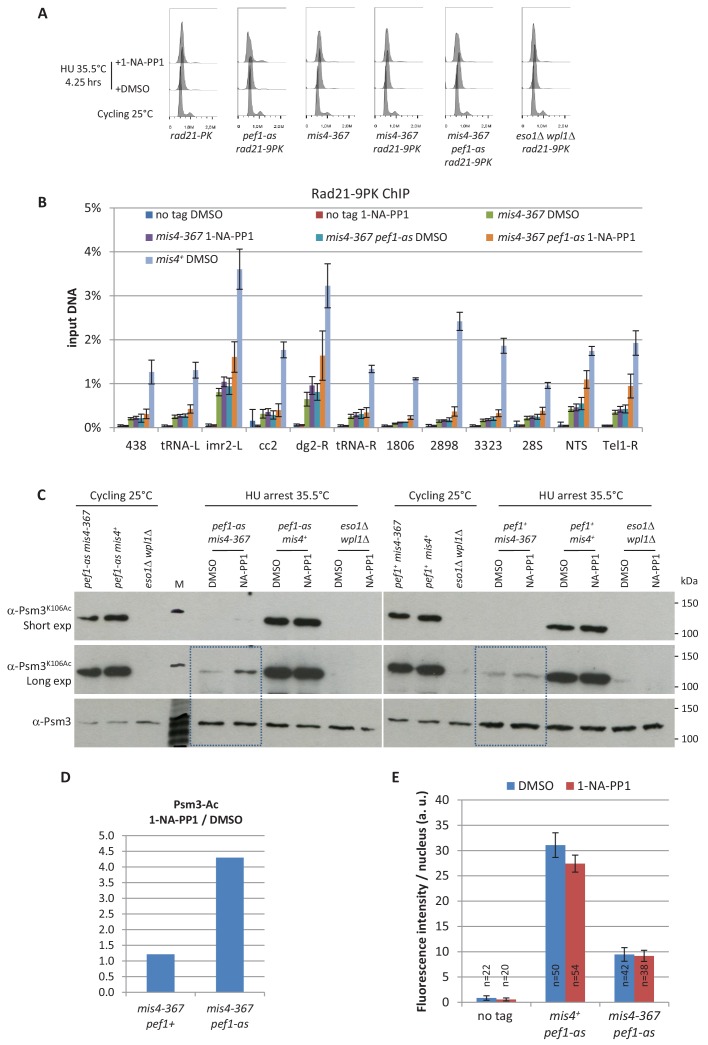
Figure 2—figure supplement 1. DNA content analysis, raw ChIP data, Psm3 acetylation and nuclear spreads from HU-arrested cells.

Figure 2—figure supplement 1.

(A) DNA content analyses. The drift in the 1C peak to the right in HU-arrested cells is due to an increase in the mitochondrial DNA content as the cells elongate (Sazer and Sherwood, 1990). (B) Rad21-9PK ChIP-qPCR results expressed as % of input DNA. The ‘no tag’ control estimates background enrichment. Bars indicate mean ± SD from 4 ChIPs (Figure 2—source data 1). (C) Effect of Pef1 kinase inhibition on Psm3 acetylation. Total protein extracts were analyzed by western blotting using the indicated antibodies. M: molecular weight markers. The boxes indicate the lanes used for signal quantification. (D) Quantification of Psm3 acetylation in mis4-367 pef1-as cells at the restrictive temperature. Band intensities were measured from the blots shown in panel C. Psm3-Ac was normalized to Psm3 and the ratios 1-NA-PP1/DMSO were calculated. (E) The inhibition of Pef1 kinase activity did not induce a global change in the total amount of chromatin-bound Rad21. The amount of chromatin-bound Rad21-9PK per nucleus was measured by nuclear spreads and indirect immunofluorescence using anti-PK antibodies. The bars represent the mean fluorescence intensity per nucleus + /- the 95% confidence interval.