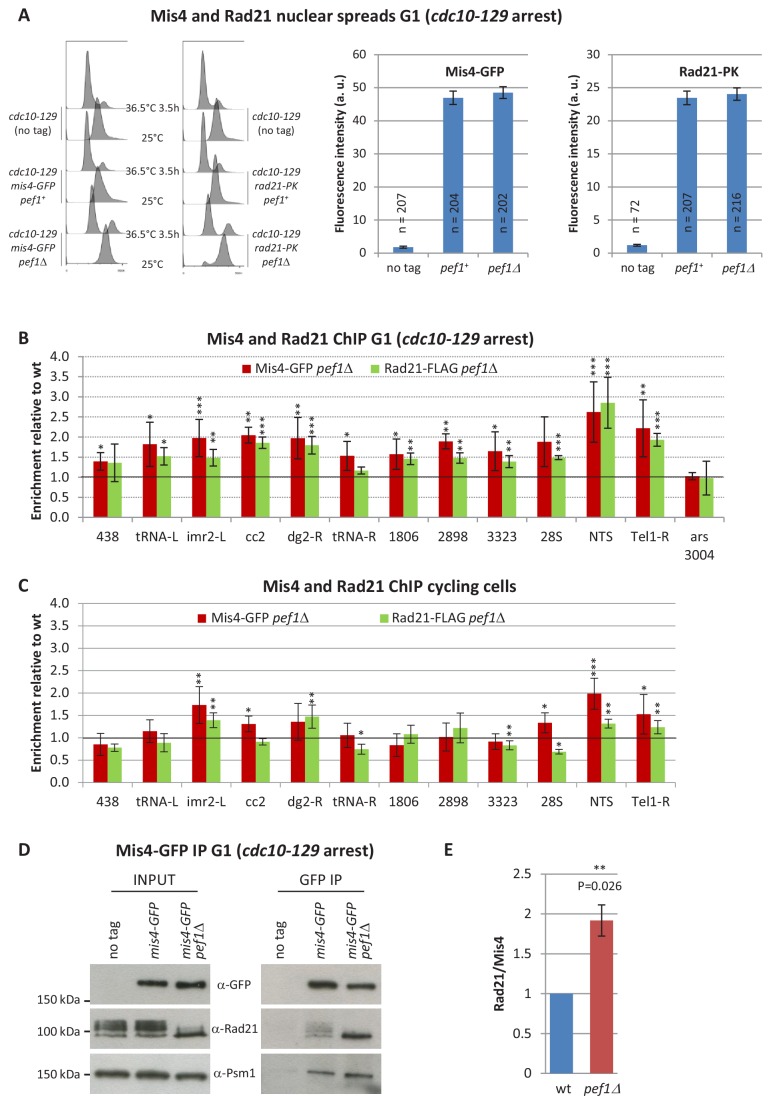
Figure 4. Pef1 ablation affects Rad21 and Mis4 binding to G1 chromosomes.
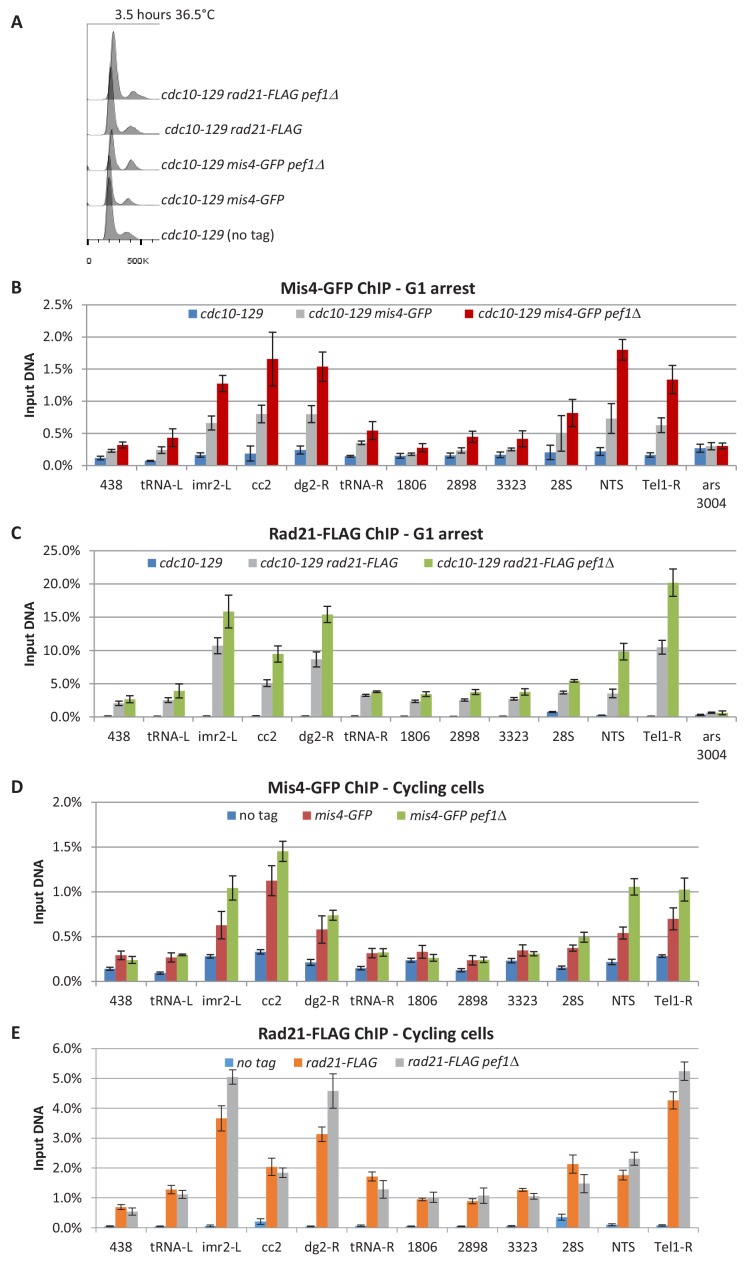
(A) Mis4-GFP and Rad21-PK binding to whole G1 nuclei. Cells were cultured at 36.5°C to induce the cdc10-129 arrest and collected after 3.5 hr. G1 arrest was monitored by DNA content analysis. Mis4-GFP and Rad21-PK binding to whole nuclei were measured by nuclear spreads and indirect immunofluorescence. The graphs show the mean fluorescence intensity per nucleus + /- the 95% confidence interval. (B) Mis4-GFP and Rad21-FLAG ChIP from G1-arrested cells. Raw ChIP data (Figure 4—figure supplement 1) were normalized to wild-type levels. Bars indicate mean ± SD, n = 4. A two-tailed, unpaired t-test was used to assess enrichment over wild-type levels. ***p≤0.001, **p≤0.01, *p≤0.05 with 95% confidence interval (Figure 4—source data 1). (C) Rad21-FLAG and Mis4-GFP ChIP from cycling cells. ChIP data (Figure 4—figure supplement 1) were normalized to wild-type levels. Bars indicate mean ± SD, n = 4. ***p≤0.001, **p≤0.01, *p≤0.05, by two-tailed, unpaired t-test with 95% confidence interval (Figure 4—source data 1). (D) Pef1 ablation increased Rad21 binding to its loader. Mis4-GFP was immuno-purified from G1 (cdc10-129) protein extracts and co-purifying proteins were analyzed by western blotting with the indicated antibodies. (E) Quantification of Rad21 in Mis4-GFP IPs. Band intensities were measured and the ratios Rad21/Mis4 were normalized to wt. Bar = mean+/-SD from four biological replicates. **p≤0.01 by one sample t test with 95% confidence interval.


