. 2020 Jan 2;9:e50556. doi: 10.7554/eLife.50556

Figure 5. Pef1 phosphorylates Rad21.

(A,B) Pef1 co-immunoprecipitates cohesin (A) and the cohesin loader Mis4 (B) from total protein extracts. (C) Western blot analysis of total protein extracts from cycling cells probed with anti-Rad21 antibodies. (D) In vitro kinase assays. Pef1-GFP immuno-purified (IP) from cycling or G1 (cdc10-129) cells was incubated with in vitro translated Rad21-HIS in the presence of ATPγS and the proteins analyzed by western blotting. Phosphorylated products were detected using an anti-thiophosphate ester antibody. (E) In vitro kinase assays. Rad21-T262A prevents Rad21 phosphorylation by Pef1. The fusion protein Psl1-Pef1-GFP phosphorylates Rad21. (F) Psl1 co-immunoprecipitates Psm1 from total protein extracts (cycling cells). (G) Rad21-PK was immuno-purified from cycling cells and probed by western blotting with the indicated antibodies. (H,I) Growth assays for suppression of the ts growth defect of mis4-367.

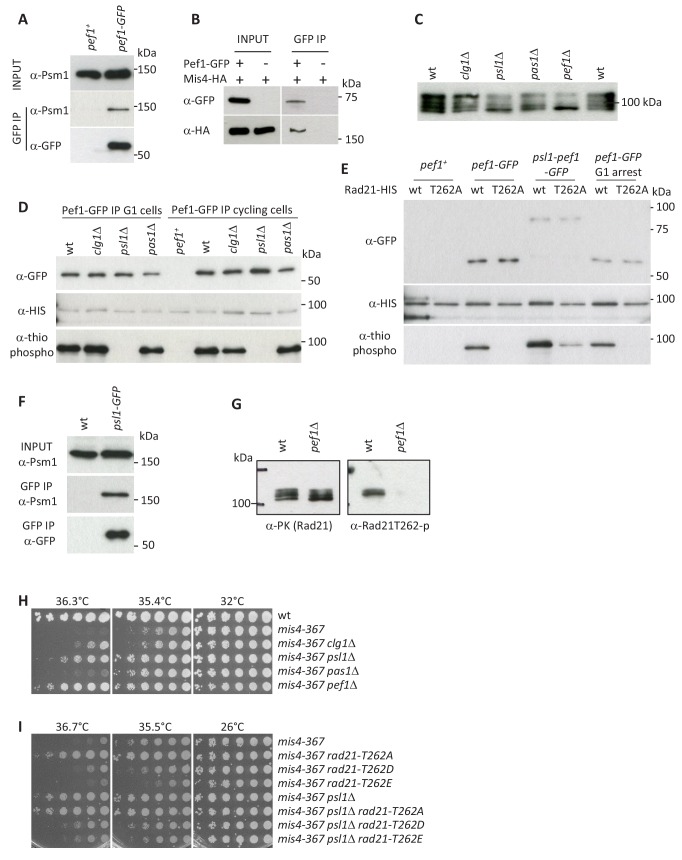
Figure 5.

Figure 5—figure supplement 1. Mapping the Pef1 phosphorylation site within Rad21.

Figure 5—figure supplement 1.

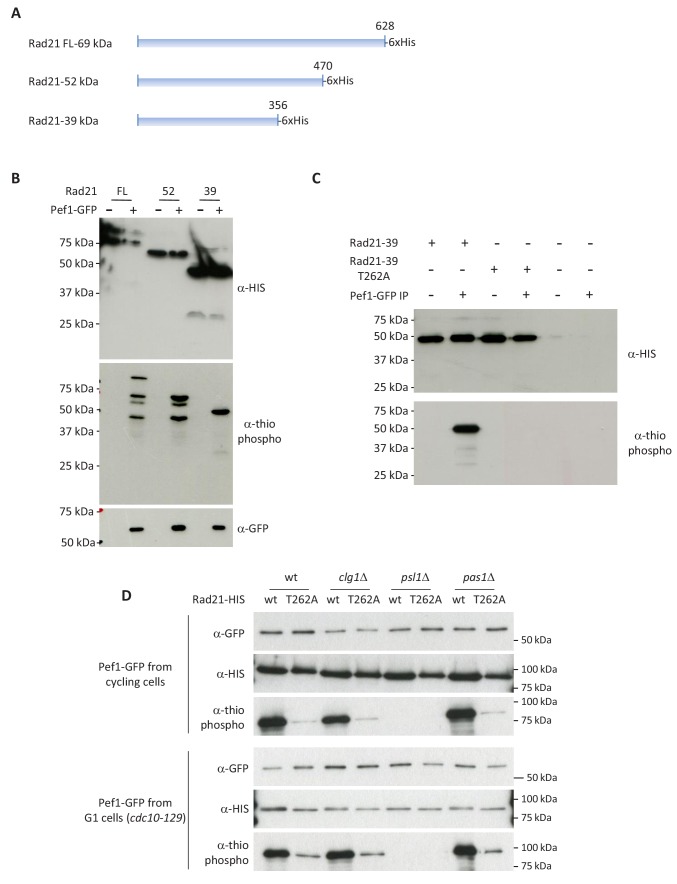
(A) Truncated forms of Rad21 used in the kinase assays. (B–C) In vitro kinase assays using Pef1-GFP purified from cycling cells. The reaction products were analyzed by western blotting with the indicated antibodies. Note that all Rad21 forms migrate slower than predicted from their calculated molecular weight. The shortest Rad21 derivative (Rad21-39) is efficiently phosphorylated by Pef1. The T262A substitution abrogates in vitro phosphorylation of Rad21-39 by Pef1. (D) Full length Rad21-T262A is a poor Pef1 substrate.
Figure 5—figure supplement 2. Rad21-T262 phosphorylation in G1, S and G2-arrested cells.

Figure 5—figure supplement 2.

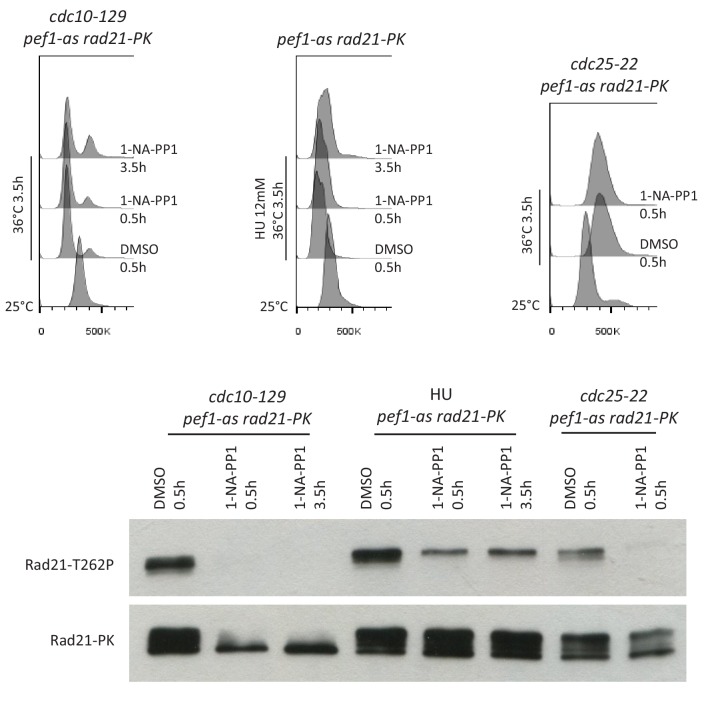
Exponentially growing cells at 25°C were shifted to 36°C and collected after 3.5 hr. For the S-phase arrest, 12 mM HU was added at the time of the temperature shift. Pef1-as inhibition was done by adding 1-NA-PP1 either from the beginning of the experiment (1-NA-PP1 3.5 hr) or 0.5 hr before cells were collected (1-NA-PP1 0.5 hr). Cell cycle arrest was monitored by DNA content analysis. The drift of the peaks to the right for the 36°C samples is due to an increase in the mitochondrial DNA content (Sazer and Sherwood, 1990). Rad21-PK was immuno-purified from total protein extracts and probed by western blotting with anti Rad21-T262p and anti-PK antibodies.