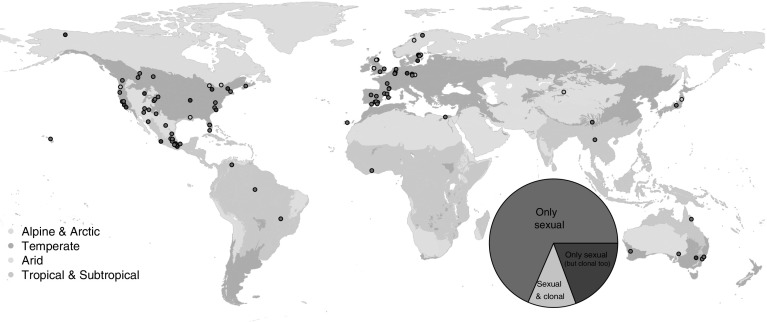
Fig. 1.
Geolocations of 118 out of the total of 181 plant species and studies here examined from the COMPADRE Plant Matrix Database (version 5.0.0), for which GPS coordinates were reported in the published studies or personally communicated. World map backgrounds showcase major habitats where the populations were studied under natural conditions. The filling color of each point corresponds to the ability of the plant species to reproduce only sexual (dark pink) or sexually as well as clonally (purple and orange). The inserted pie chart represents the proportion of studied species with population dynamics for species with only sexual reproduction (dark pink, n = 124 species), where the species can reproduce clonally, but only sexual reproduction was examined in the original study (n = 35), and species where both sexual and clonal reproduction were explicitly modelled (n = 22). (Color figure online)

