. 2019 Dec 10;8:e46015. doi: 10.7554/eLife.46015

Figure 1. Speech-related neuronal spiking activity in dorsal motor cortex.

(A) Participants heard a syllable or word prompt played from a computer speaker and were instructed to speak it back after hearing a go cue. Motor cortical signals and audio were simultaneously recorded during the task. The timeline shows example audio data recorded during one trial. (B) Participants’ MRI-derived brain anatomy. Blue squares mark the locations of the two chronic 96-electrode arrays. Insets show electrode locations, with shading indicating the number of different syllables for which that electrode recorded significantly modulated firing rates (darker shading = more syllables). Non-functioning electrodes are shown as smaller dots. CS is central sulcus. (C) Raster plot showing spike times of an example neuron across multiple trials of participant T5 speaking nine different syllables, or silence. Data are aligned to the prompt, the go cue, and acoustic onset (AO). (D) Trial-averaged firing rates (mean ± s.e.) for the same neuron and two others. Insets show these neurons’ action potential waveforms (mean ± s.d.). The electrodes where these neurons were recorded are circled in the panel B insets using colors corresponding to these waveforms. (E) Time course of overall neural modulation for each syllable after hearing the prompt (left alignment) and when speaking (right alignment). Population neural distances between the spoken and silent conditions were calculated from TCs using an unbiased measurement of firing rate vector differences (see Methods). This metric yields signed values near zero when population firing rates are essentially the same between conditions. Firing rate changes were significantly greater (p < 0.01, sign-rank test) during speech production (comparison epoch shown by the black window after Go) compared to after hearing the prompt (gray window after Prompt). Each syllable’s mean modulation across the comparison epoch is shown with the corresponding color’s horizontal tick to the right of the plot. The vertical scale is the same across participants, revealing the larger speech-related modulation in T5’s recordings.

Figure 1.

Figure 1—figure supplement 1. Prompted speaking tasks behavior.

Figure 1—figure supplement 1.

(A) Acoustic spectrograms for the participants’ spoken syllables. Power was averaged over all analyzed trials. Note that da is missing for T5 because he usually misheard this cue as ga or ba. (B) Same as panel A but for the words datasets. (C) Reaction time distributions for each dataset.
Figure 1—figure supplement 2. Example threshold crossing spike rates.

Figure 1—figure supplement 2.

The left column shows –4.5 × root mean square voltage threshold crossing firing rates during the syllables task, recorded on the electrodes from which the single neuron spikes in Figure 1D were spike sorted. The right column shows three additional example electrodes’ firing rates. Insets shows the unsorted threshold crossing spike waveforms.
Figure 1—figure supplement 3. Neural activity while speaking short words.

Figure 1—figure supplement 3.

(A) Firing rates during speaking of short words for three example neurons (blue spike waveform insets) and three example electrodes’ −4.5 × RMS threshold crossing spikes (gray waveform insets). Data are presented similarly to Figure 1D and are from the T5-words and T8-words datasets. (B) Firing rate differences compared to the silent condition across the population of threshold crossings, presented as in Figure 1E. The ensemble modulation was significantly greater when speaking words compared to when hearing the prompts (p<0.01, sign-rank test).
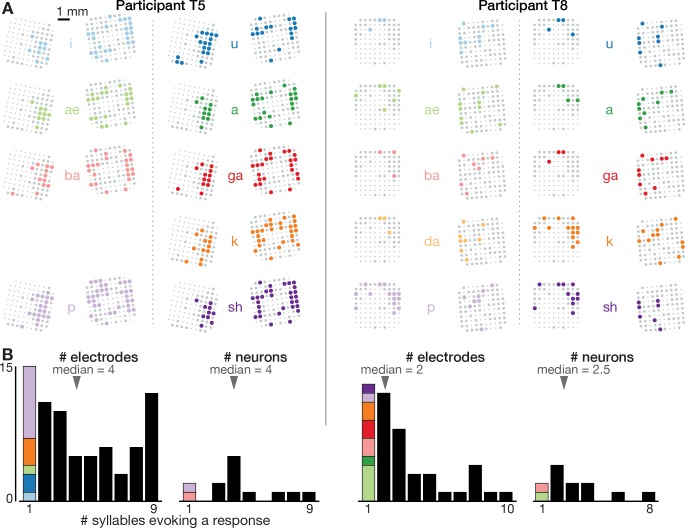
Figure 1—figure supplement 4. Neural correlates of spoken syllables are not spatially segregated in dorsal motor cortex.

Figure 1—figure supplement 4.

(A) Electrode array maps similar to Figure 1B insets are shown for each syllable separately to reveal where modulation was observed during production of that sound. Electrodes where the TCs firing rate changed significantly during speech, as compared to the silent condition, are shown as colored circles. Non-modulating electrodes are shown as larger gray circles, and non-functioning electrodes are shown as smaller dots. Adding up how many different syllables each electrode’s activity modulates to yields the summary insets shown in Figure 1B. These plots reveal that electrodes were not segregated into distinct cortical areas based on which syllables they modulated to. (B) Histograms showing the distribution of how many different syllables evoke a significant firing rate change for electrode TCs (each participant’s left plot) and sorted single neurons (right plot). The first bar in each plot, which corresponds to electrodes or neurons whose activity only changed when speaking one syllable, is further divided based on which syllable this modulation was specific to (same color scheme as in panel A). This reveals two things. First, single neurons or TCs (which may capture small numbers of nearby neurons) were typically not narrowly tuned to one sound. Second, there was not one specific syllable whose neural correlates were consistently observed on separate electrodes/neurons from the rest of the syllables.
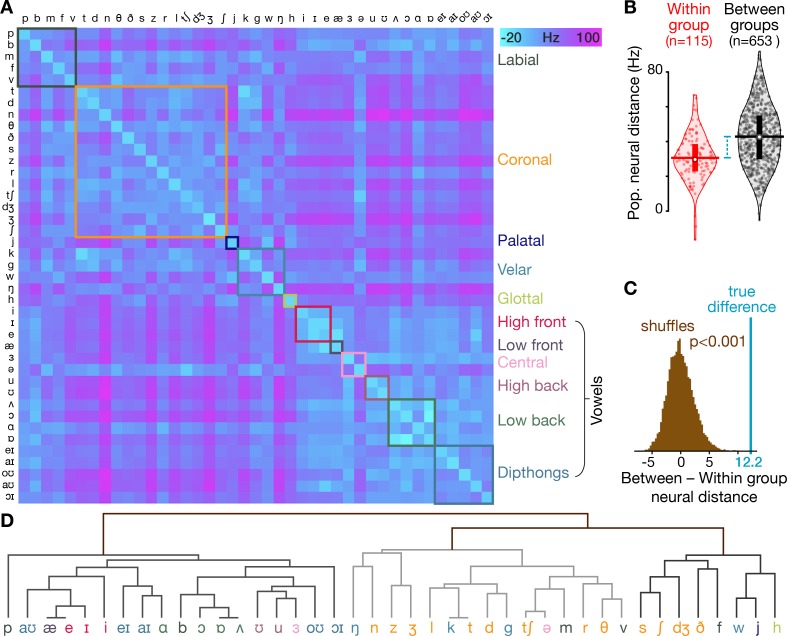
Figure 1—figure supplement 5. Neural activity shows phonetic structure.

Figure 1—figure supplement 5.

(A) The T5-phonemes dataset consists of the participant speaking 420 unique words which together sampled 41 American English phonemes. We constructed firing rate vectors for each phoneme using a 150 ms window centered on the phoneme start (one element per electrode), averaged across every instance of that phoneme. This dissimilarity matrix shows the difference between each pair of phonemes’ firing rate vectors, calculated using the same neural distance method as in Figure 1E. The matrix is symmetrical across the diagonal. Diagonal elements (i.e. within-phoneme distances) were constructed by comparing split halves of each phoneme’s instances. The phonemes are ordered by place of articulation grouping (each group is outlined with a box of different color). (B) Violin plots showing all neural distances from panel A divided based on whether the two compared phonemes are in the same place of articulation group (‘Within group’, red) or whether the two phonemes are from different place of articulation groups (‘Between groups’, black). Center circles show each distribution’s median, vertical bars show 25th to 75th percentiles, and horizontal bars shows distribution means. The mean neural distance across all Within group pairs was 30.6 Hz, while the mean across all Between group pairs was 42.8 Hz (difference = 12.2 Hz). (C) The difference in between-group versus within-group neural distances from panel B, marked with the blue line, far exceeds the distribution of shuffled distances (brown) in which the same summary statistic was computed 10,000 times after randomly permuting the neural distance matrix rows and columns. These shuffles provide a null control in which the relationship between phoneme pairs’ neural activity differences and these phonemes’ place of articulation groupings are scrambled. (D) A hierarchical clustering dendrogram based on phonemes’ neural population distances from panel A. At the bottom level, each phoneme is placed next to the (other) phoneme with the most similar neural population activity. Successive levels combine nearest phoneme clusters. By grouping phonemes based solely on their neural similarities (rather than one specific trait like place of articulation, indicated here with the same colors as in the panel A groupings), this dendrogram provides a complementary view that highlights that many neural nearest neighbors are phonetically similar (e.g. /d/ and /g/ stop-plosives, /θ/ and /v/ fricatives, /ŋ/ and /n/ nasals) and that related phonemes form larger clusters, such as the left-most major branch of mostly vowels or the sibilant cluster /s/, /ʃ/, and /dʒ/. At the same time, there are some phonemes that appear out of place, such as plosive consonant /b/ appearing between vowels /ɑ/ and /ɔ/ (we speculate this could reflect neural correlates of co-articulation from the vowels that frequently followed the brief /b/ sound).