(
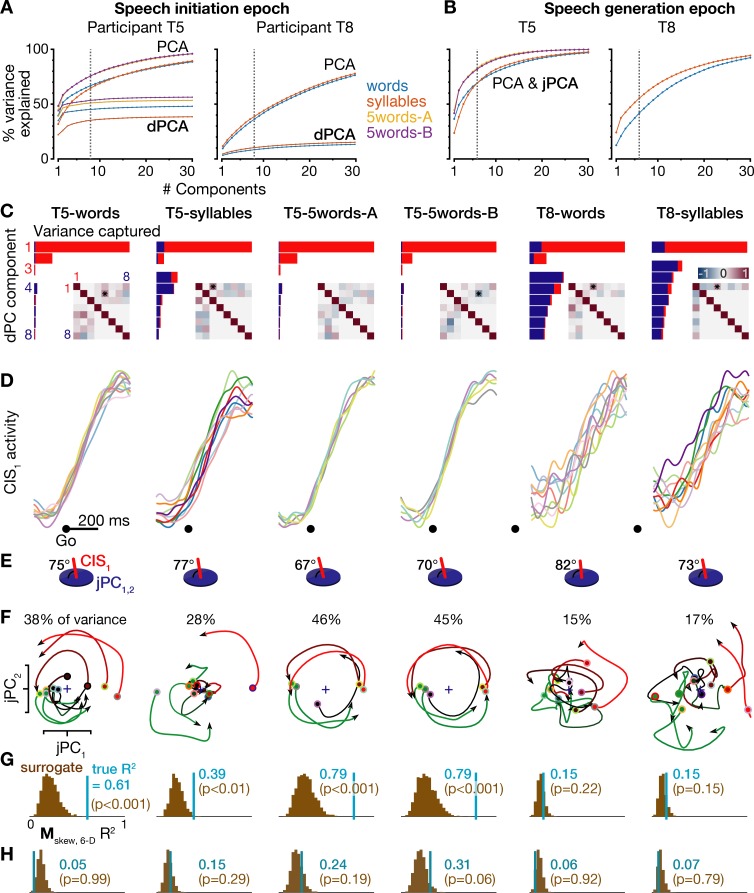
A) Cumulative trial-averaged firing rate variance explained during each dataset’s speech initiation epoch as a function of the number of PCA dimensions (top set of curves) and dPCA dimensions (bottom set of curves) used to reduce the dimensionality of the data. The dotted lines mark the eight dimensions used for dPCA in the condition-invariant signal analyses for panels C-E and in
Figure 4. In addition to the T5-words and T8-words datasets (blue curves) shown in
Figure 4, this figure also shows results from the T5-syllables and T8-syllables datasets (orange curves) as well as the T5-5words-A and T5-5words-B replication datasets (gold and purple curves). (
B) Cumulative trial-averaged firing rate variance explained during all six datasets’ speech generation epochs. The dotted lines mark the six dimensions used for jPCA in the rotatory dynamics analyses for panels E-H and
Figure 5. PCA and jPCA curves are one and the same because jPCA operates within the neural subspace found using PCA. (
C) Firing rates during the speech initiation epoch of each dataset were decomposed into dPCA components like in
Figure 4A. The additional inset matrices quantify the relationships between dPC components as in
Kobak et al. (2016): each element of the upper triangle shows the dot product between the corresponding row’s and column’s demixed principal
axes (i.e. the dPCA encoder dimensions), while the bottom triangle shows the correlations between the corresponding row’s and column’s demixed principal
components (i.e. the neural data projected onto this row’s and column’s demixed principal decoder axes). More red or blue upper triangle elements denote that this pair of neural dimensions are less orthogonal, while more red or blue lower triangle elements denote that this pair of components (summarized population firing rates) have a similar time course. Stars denote pairs of dimensions that are significantly non-orthogonal at p<0.01 (Kendall correlation). (
D) Neural population activity projected onto the first dPC dimension, shown as in
Figure 4B for all six datasets. (
E) The subspace angle between the CIS
1 dimension from panels C,D and the top jPC plane from panel F, for each dataset. Across all six datasets, the CIS
1 was not significantly non-orthogonal to any of the six jPC dimensions (p>0.01, Kendall correlation) except for the angle between CIS
1 and jPC
5 in the T5-words dataset (70.5°, p<0.01). (
F) Neural population activity for each speaking condition was projected into the top jPCA plane as in
Figure 5A, for all six datasets. (
G) The same statistical significance testing from
Figure 5B was applied to all datasets to measure how well a rotatory dynamical system fit ensemble neural activity. (
H) Rotatory neural population dynamics were not observed when the same jPCA analysis was applied on each dataset’s neural activity from 100 to 350 ms after the audio prompt. Rotatory dynamics goodness of fits are presented as in the previous panel.


