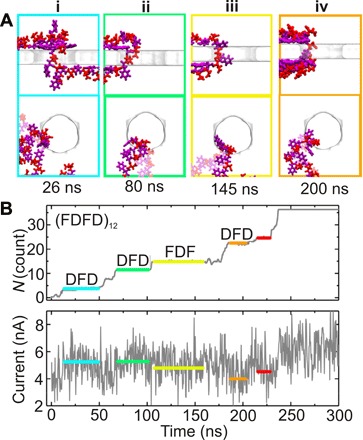
Fig. 6. Ionic current blockades produced by an (FDFD)12 peptide translocating through a nanopore spanning a 2D MoS2 membrane.

(A) i to iv: Snapshots of the representative conformations of the (FDFD)12 peptide translocating through a 2.2-nm-diameter pore at a 600-mV bias at 26, 80, 145, and 200 ns, corresponding to the first, second, third, and fourth translocation pauses indicated by boxes highlighted in cyan, green, yellow, and orange, respectively. The AA phenylalanine (F) is shown in magenta, and aspartic acid (D) is shown in red. (B) Top: A tally of the number of AA residues of (FDFD)12 peptide that have translocated through the nanopore. The colored horizontal lines highlight the pauses in the translocation. The corresponding AA fragments in the nanopore are indicated above the colored lines. Bottom: In correspondence with (top), the ionic current through the pore is shown. The gray line represents the actual fluctuating current through the pore, while the colored horizontal lines denote the average ionic current at each translocation pause. The color and the length of the line match that from the translocation trace shown in (B) [adapted from Chen et al. (80)].
