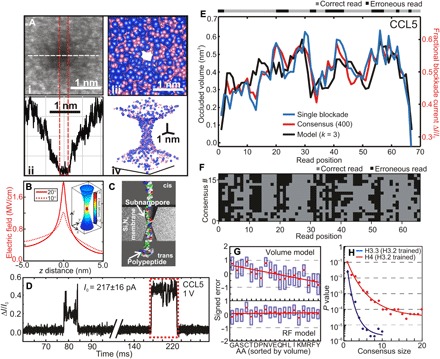
Fig. 7. Protein sequence analysis using a subnanopore spanning a silicon nitride membrane.

(A) (i) The topography of a subnanopore is revealed by an HAADF-STEM image acquired with an aberration-corrected microscope. (ii) The corresponding line plot through the subnanopore is shown associated with the white dashed line in (i), which indicates the mass density under the beam. The shot noise between the red dashed lines indicates the subnanopore diameter. The subnanopore has a (geometric) mean diameter at the waist of 0.28 nm. (iii) A 2D projection from the top through the model that indicates the atomic distribution near the pore waist. The atoms are depicted by space-filling models in which each Si is represented by a blue sphere with a 0.235-nm diameter and each N is a pink sphere with a 0.130-nm diameter. (iv) A 3D perspective of space-filled representations of the pore model of (iii). For clarity, only atoms on the pore surface are depicted. (B) Finite-element simulations of the electric field distribution along the vertical z axis of a pore with a 0.4-nm diameter at the waist and a biconical structure with a 10°/20° cone angle through a nominally 10-nm-thick silicon nitride membrane immersed in 250 mM NaCl at 0.6-V bias. The field is focused over an extent of 1.5 nm near the pore waist. Inset: Superimposed on a model of the pore topography is shown a heat map of the field distribution with a 20° cone angle [adapted from Rigo et al. (78)]. (C) A schematic representation of the translocation of a protein through a subnanopore. The denatured protein is supposed to be rod-like. (D) Consecutive current traces are shown that illustrate the distribution of the duration and fractional blockade currents associated with translocations of single molecules of CCL5 through a 0.5 × 0.6 nm2 pore at 1V. In the figure, higher values correspond to larger blockade currents. (E) A 400-blockade consensus (red) for CCL5 through a pore with a 0.5 × 0.6–nm2 cross section, juxtaposed with an AA volume model (assuming k = 3; black) and a single highly correlated blockade [Pearson correlation coefficient (PCC) = 0.67; blue]. The error map above the plot indicates the read accuracy. (F) A grayscale error map of 400 partitioned blockades illustrating correct reads and misreads [adapted from Kennedy et al. (75)]. (G) A comparison between the signed error for AAs constituting H3.2 protein in order of increasing volume naïve volume (top) and random-forest (RF) regression model (bottom) for CCL5. The volume model underestimates signals associated with small volumes, whereas the RF model shows no bias. (H) The median P value is shown as a function of the number of blockades in a cluster for H4 and H3.3 trained on H3.2. The solid lines represent exponential fits. The decoy database size is 105 for H4 and 5 × 10⁶ for H3.3. The P value approaches zero for a consensus >10 [adapted from Kolmogorov et al. (77)].
