
Fig. 2. Reinforced PRC1 binding is associated with increased interactions and transcriptional activation at the larval stage.
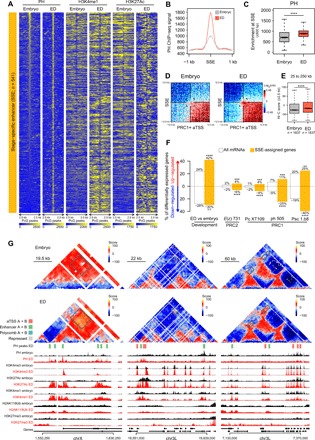
(A) PH, H3K4me1, and H3K27Ac ChIP-seq tracks centered on stage-specific enhancer (SSE) sites that only overlap with PRC1 peaks at the larval stage (±2.5 kb). (B and C) PH ChIP-seq average tracks in a 2-kb window centered on SSEs at embryonic (in gray) and larval stages (in orange). Corresponding quantifications (±500 bp) are shown in (C). Wilcoxon, ****P < 1 × 10⁻⁵. (D and E) Log2(o/e) aggregate interactions within 25-kb windows centered on PRC1-bound aTSSs and SSEs between 25 and 250 kb in embryos (left) and EDs (right). Corresponding quantifications (±2.5 kb) are shown in (E). Wilcoxon, ****P < 1 × 10⁻⁵. (F) Percentage of significantly up- (top) and down-regulated (bottom) SSE-assigned genes during development (on the left) or between control and PRC2 [E(z)731] or PRC1 (PcXT109, ph505, and Psc1.B8) mutant EDs (on the right, padjust cutoff = 0.001). Hypergeometric test, ****P < 1 × 10⁻⁵; ***P < 1 × 10⁻³; **P < 1 × 10⁻²; N.S., not significant. (G) Screenshots of Hi-C maps centered on developmentally regulated enhancer-promoter loops anchored at active PRC1 binding sites in embryo (top panels) and ED (middle panels). PRC1 peaks from ED and their assigned clusters are shown below Hi-C screenshots (legend on the upper left) and projected on the maps as white squares. At the bottom, PTM ChIP-seq tracks are shown for embryos (black) and EDs (red).