
Fig. 5. PRC1 redeployment at developmental enhancers correlates with transcriptional activation and increased enhancer-promoter loops during NPC specification in mouse cells.
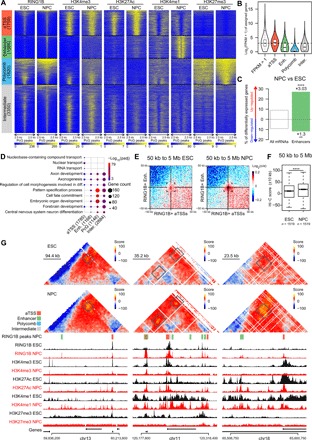
(A) k-Means clustering of RING1B, H3K4me3, H3K27Ac, H3K4me1, and H3K27me3 ChIP-seq signals from NPCs centered on RING1 peaks from NPCs (±2.5 kb). Clusters are depicted on the left. Corresponding ChIP-seq tracks from ESCs are shown for comparison. (B) Violin plot of the log2(FPKM + 1) of the genes assigned to each cluster in NPCs. (C) Bar graph of the percentage of significantly up- (top) and down-regulated (bottom) genes between ESCs and NPCs (padjust cutoff = 0.001). Hypergeometric test, ****P < 1 × 10⁻⁵; **P < 1 × 10⁻². (D) Comparative Gene Ontology (GO) analysis of the genes assigned to each cluster. (E and F) Log2(o/e) aggregate interactions within 100-kb windows centered on RING1B-bound aTSS and enhancer sites between 50 kb and 5 Mb in ESCs (left) and NPCs (right). Corresponding quantifications are shown in (F) (±10 kb). Wilcoxon, ****P < 1 × 10⁻⁵. (G) Screenshots of Hi-C maps centered on developmentally regulated enhancer-promoter loops anchored at active RING1B binding sites in ESCs (top panels) and NPCs (middle panels). RING1B peaks from NPCs, and their assigned clusters are shown below Hi-C screenshots (see legend on the upper left) and are projected on the maps as white squares. On the bottom panels, PTM ChIP-seq tracks are shown for ESCs (black) and NPCs (red).