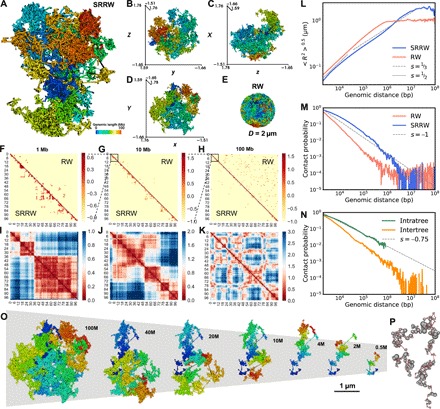
Fig. 2. Typical single-cell level chromatin structure and its scaling behaviors predicted by our model.

(A to D) Folded structure of our modeled chromatin and its xyz projections. (E) Equilibrium globule (confined RW) as a reference system. (F to H) Predicted single-cell level contact maps from local (1 Mb) to global (100 Mb) based on SRRW and RW. (I to K) Physical distance maps of SRRW from local to global. (L) Root mean square end-to-end distance (R) scaling of SRRW and RW. As guide to the eye, the dashed and dotted lines show power-law scaling, with exponents being 1/3 and 1/2, respectively. (M) Contact scaling of SRRW and RW. As guide to the eye, the dashed line shows power-law scaling, with exponent being −1. (N) Contact scaling of SRRW for intra- and intertree contacts. The intratree contacts are richer than the intertree ones and follow a power-law scaling with exponent s = −0.75, akin to the contact scaling within TADs. (O) Structures of the modeled chromatin at different genomic scales. (P) Beads-on-string representation of the secondary structure of chromatin modeled by a free SRRW. Tree domains are represented in beads, with the size of the bead corresponding to the genomic size of the domain. The backbone is represented in string.
