
Fig. 4. A 3D map of tree domains and their structural statistics.
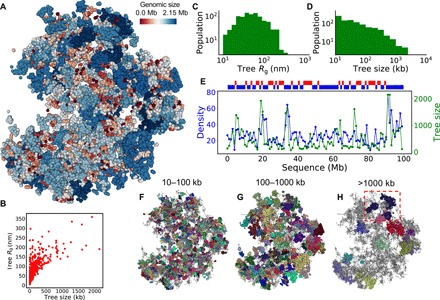
(A) Particle representation of the modeled chromatin with tree domains colored according to their genomic sizes in logarithm scale. (B) Scatter plot of the physical size (Rg) of tree domains versus their genomic sizes, with each domain being one point. (C) Physical size (Rg) distribution of tree domains. (D) Genomic size distribution of tree domains. (E) Local DNA density and averaged tree domain size walking along the sequence of the modeled chromatin, with each step being 1 Mb. Above the panel, the local density is divided into two groups, showing in red (low density) and blue (high density). (F to H) Tree domains marked by random colors in three size groups (10 to 100 kb, 100 to 1000 kb, and above 1000 kb). The unmarked structures are shown in gray. An example of subdomains inside a tree domain is highlighted in (H).