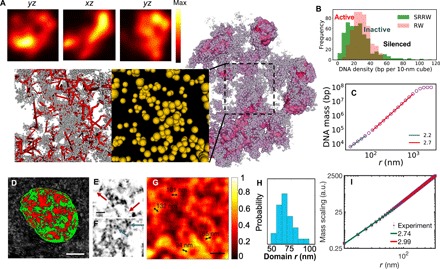
Fig. 5. Granular and porous chromatin packing across scales demonstrated by model and experiments.

(A) Density field representation (with nanoscale fluctuation filtered) of the modeled chromatin (shown in purple) and its cross sections in three orthogonal directions (shown in the top panels). Zoomed-in bottom panels show the nanoscale packing of the modeled chromatin (without filter). Backbone segments are represented in red lines, and nanocluster tree nodes are represented as yellow particles, with the volume being proportional to the genomic size. (B) Local DNA density spectrum sampled by walking along the modeled chromatin with a probe of 150-nm radius (green). A reference is sampled from an RW (red). (C) DNA mass scaling of the modeled chromatin (sampled over 1000 SRRW trajectories). (D) Typical live cell PWS image of an A549 cell showing chromatin packing domains of mass fractal–like structure. Scale bar, 5 μm. High D regions are scaled in red, while low D regions are shown in green. D of 2.3 was used as a cutoff to separate high and low D regions. (E to G) ChromSTEM images of A549 cells. (E and F) Linker DNA (red arrows) and individual nucleosomes (blue arrows) captured by ChromSTEM. Scale bar, 30 nm. (G) Chromatin volume concentration based on the convolution of ChromSTEM image. Scale bar, 200 nm. (H) Histogram of chromatin domain size distribution based on the chromatin volume concentration. (I) DNA mass scaling based on ChromSTEM. a.u., arbitrary units.
