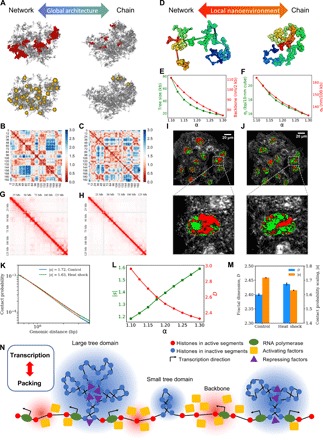
Fig. 6. Coupling between chromatin properties during structural alternation.

(A) Global architectural alternation as α changes. Left: Network-like (small α). Right: Chain-like (large α). For each structure, the five largest tree domains are shown in red in the first row, and the tree nodes larger than 40 kb are shown in yellow in the second row. (B and C) Physical distance maps at small (left) and large (right) α values. (D) Two different nanoenvironments at small (left) and large (right) α values. (E) Tree domain sizes and backbone openness as functions of α. (F) SDs of local DNA density and end-to-end distance as functions of α. (G and H) Contact matrices of hESCs exposed to heat shock and at normal temperature. (I and J) PWS live-cell images of HCT116 cells under heat shock and normal temperature conditions. (K) Contact probability curves for hESCs under normal temperature and heat shock conditions for the 100-kb to 1-Mb range. (L) How contact scaling and effective mass scaling for 100-kb to 1-Mb modeled chromatin segment depend on α. (M) Trends of contact probability scaling change and heterogeneity change after heat shock based on Hi-C analysis and PWS measurements. (N) Schematic presentation of the interplay between transcription and chromatin packing. High DNA density (inactive) regions are highlighted in blue, and low DNA density (active) regions are highlighted in red. For a simple demonstration, we scaled down all the domains, which are expected to contain more nucleosomes in reality.
