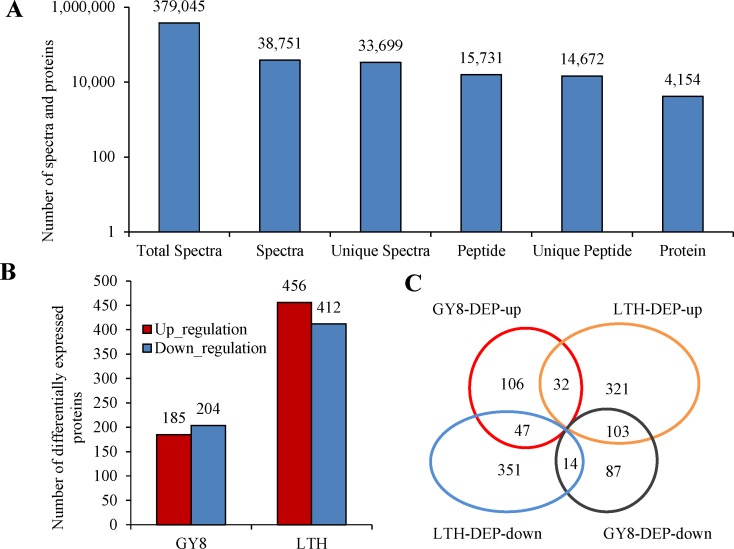
Fig 2. Distribution of differentially expressed proteins (DEPs) between the resistant (GY8) and susceptible (LTH) variety following inoculation with M. oryzae.
A: Results of the mass spectrometry analysis and protein identification. B: Number of up-regulated and down-regulated proteins. C: Venn diagram analysis the DEPs that were up- or down-regulated in GY8 and LTH.

