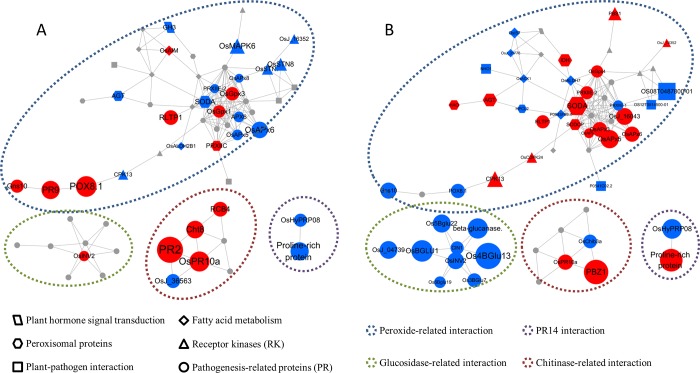
Fig 4. Interaction network of crucial DEPs in GY8 and LTH.
A: Interaction network of DEPs in GY8; B: Interaction network of DEPs in LTH. The color of spot represents the expression pattern. Red represents up-regulated, blue represents down-regulated and gray represents unchanged. The size of spot represents the fold-change, the bigger the size, the higher the fold-change. The shape represents the family or pathway of the protein. Four main clusters were circled by broken Line with different color.

