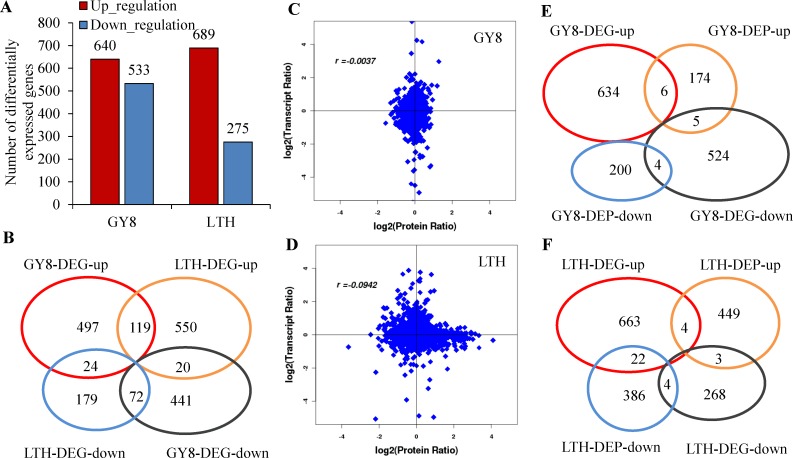
Fig 6. Distribution of differentially expressed genes (DEGs) between GY8 and LTH after inoculation with M. oryzae.
A: The numbers of up-regulated and down-regulated genes in GY8 and LTH following M. oryzae infection; B: Venn diagram of DEGs between GY8 and LTH; C, D: Concordance between changes in and its encoded protein in the developing grains at four sampling times. Transcript ratio and Protein ratio, the fold changes of transcript and protein after inoculated with M. oryzae, in LTH and GY8, respectively. r, Pearson correlations coefficient of the comparisons between fold changes of proteins and transcripts; E: Venn diagram between DEPs and DEGs of LTH after inoculated with M. oryzae; F: Venn diagram between DEPs and DEGs of LTH after inoculated with M. oryzae.

