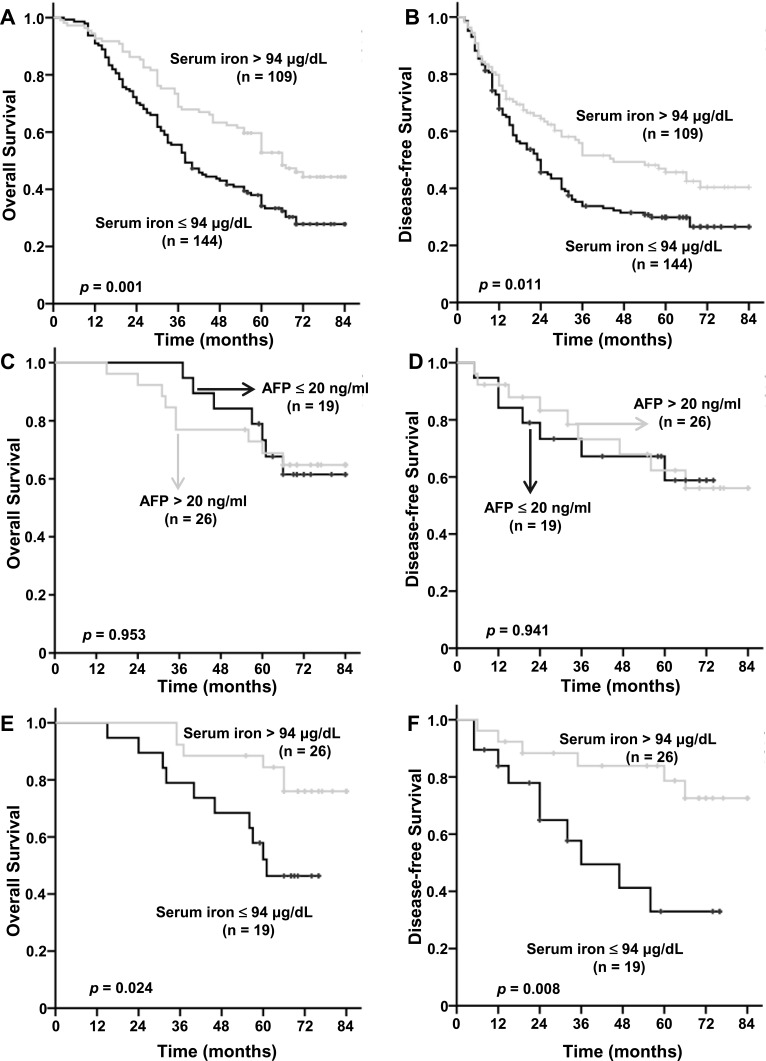
Figure 6.
The relationship of serum iron level with OS or DFS.
Notes: (A, B) In the overall population, Kaplan–Meier analysis revealed significantly shorter OS (A) and DFS (B) in HCC patients with serum iron ≤94 μg/dL than in those with serum iron >94 μg/dL. (C–F) In SHCC subgroup, no significant differences in OS (C) or DFS (D) are seen between AFP ≤20ng/mL and AFP >20ng/mL, OS (E) and DFS (F) of patients with serum iron ≤94 μg/dL were shorter than in those with serum iron >94 μg/dL.

