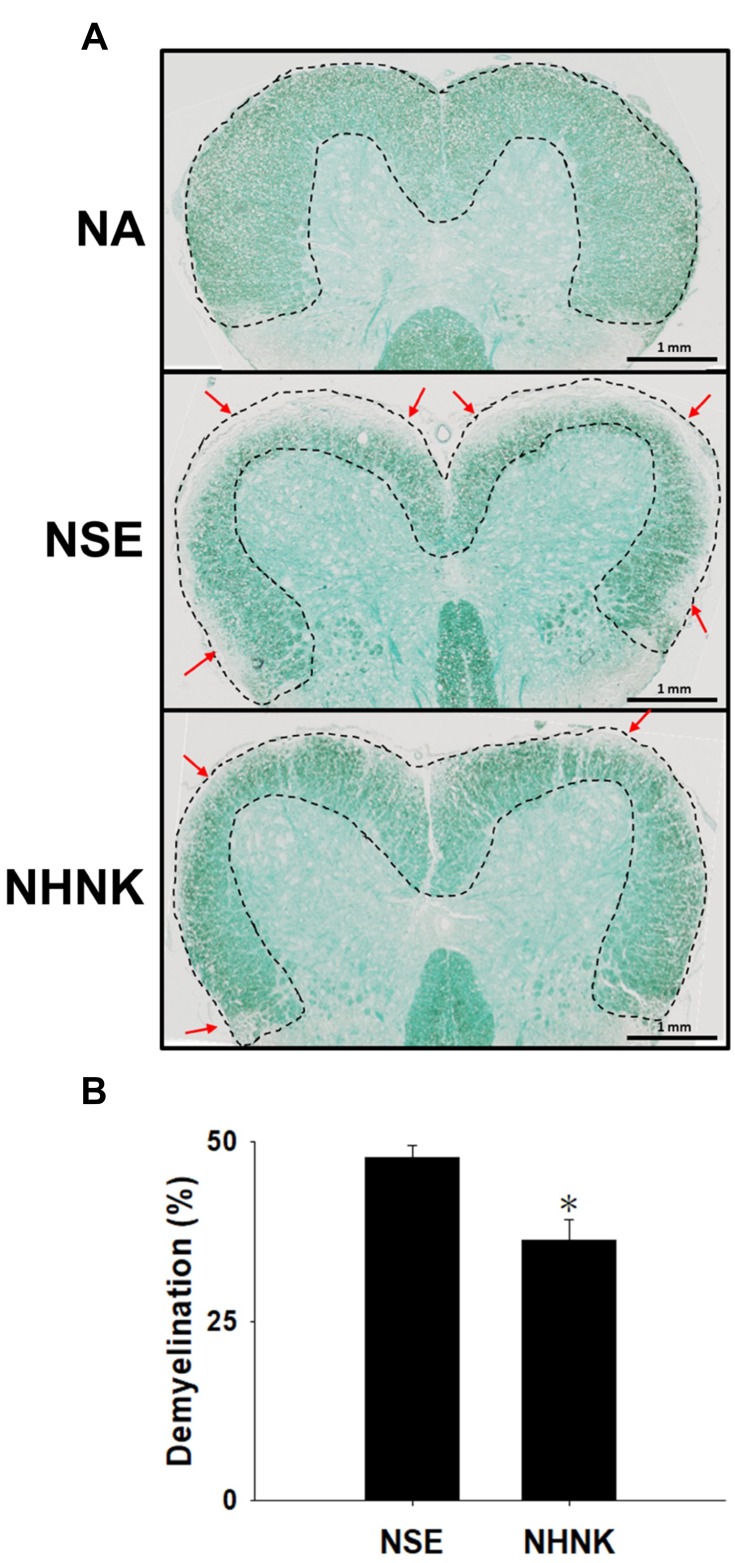
Figure 3.
NHNK treatment attenuated demyelination in the spinal cords of EAE mice. (A) Representative tissue sections stained with LFB are shown. Areas marked by the dashed line show normal myelinated regions. Red arrows indicate demyelination. (B) The percentage of demyelination was quantified using ImageJ software as described in the Materials and methods. The data are expressed as the mean ± SE of 8−11 samples per group. *p < 0.05 as compared to the NSE group. The results are a representative of three independent experiments.

