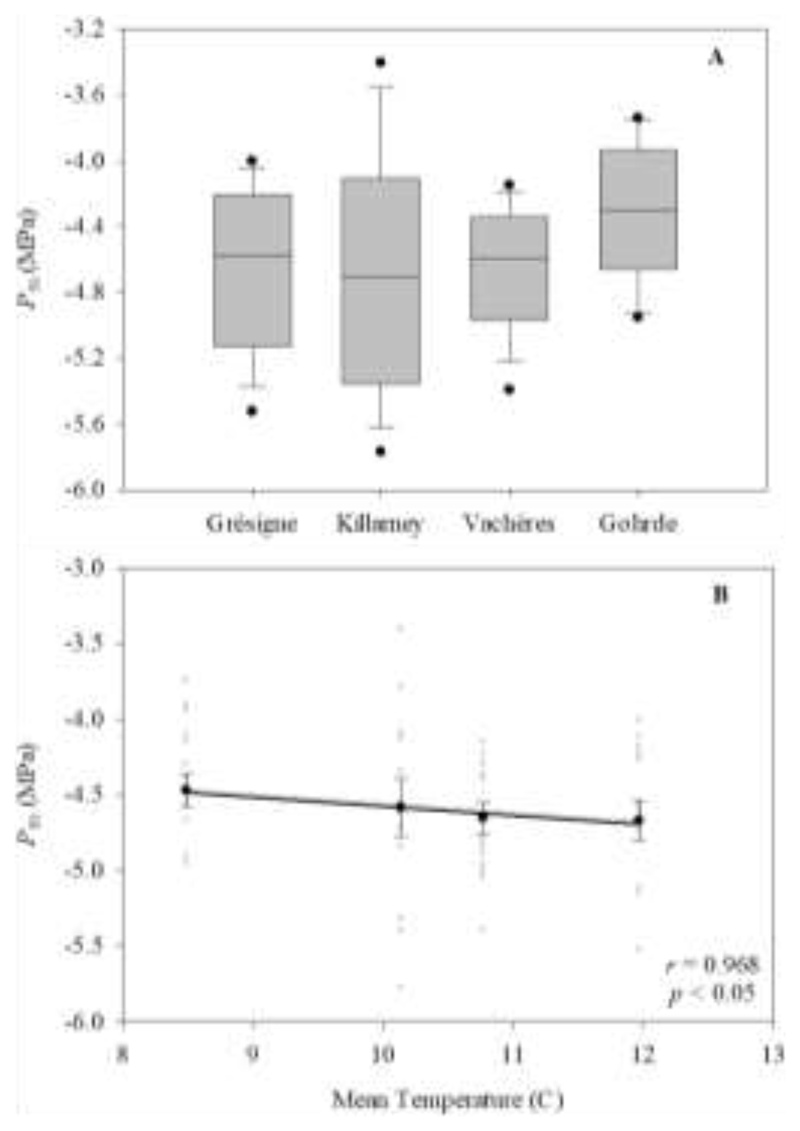
Fig. 3.
A) Box plot of P50 (i.e. pressure at which 50% loss of stem conductivity occurs) for each of the four provenances in which resistance to embolism was evaluated. From 13 to 15 different branches from different trees were used for each provenance. No significant differences between provenances were observed in P50 (p = 0.21). B) Significant correlation between P50 and mean temperature. A linear regression was fitted to the whole dataset (r, Pearson product-moment correlation; p, significance levels of the p values of the slope). The error bars represent ± the standard error.

