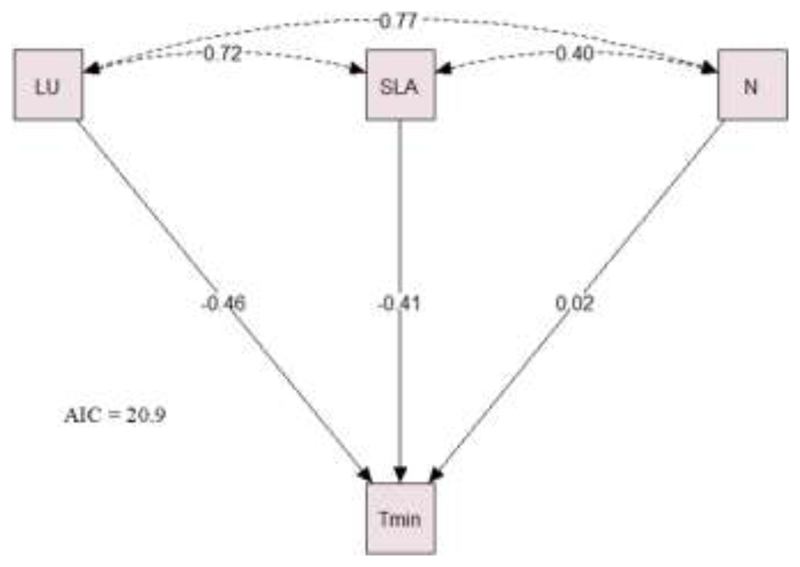
Fig. 6.
Path diagram of the model that best describes (lower Akaike information criterion (AIC)) the relationship between climate variables and functional traits. Solid and dashed lines indicate direct or indirect effects, respectively, between variables and traits. Values in the arrows indicate the standardized coefficients (std.all), and refer to standardized estimates of the variances of both continuous observed and latent variables. LU: Leaf unfolding; SLA: Specific Leaf Area; N: Leaf Nitrogen content; Tmin: minimum temperature.

