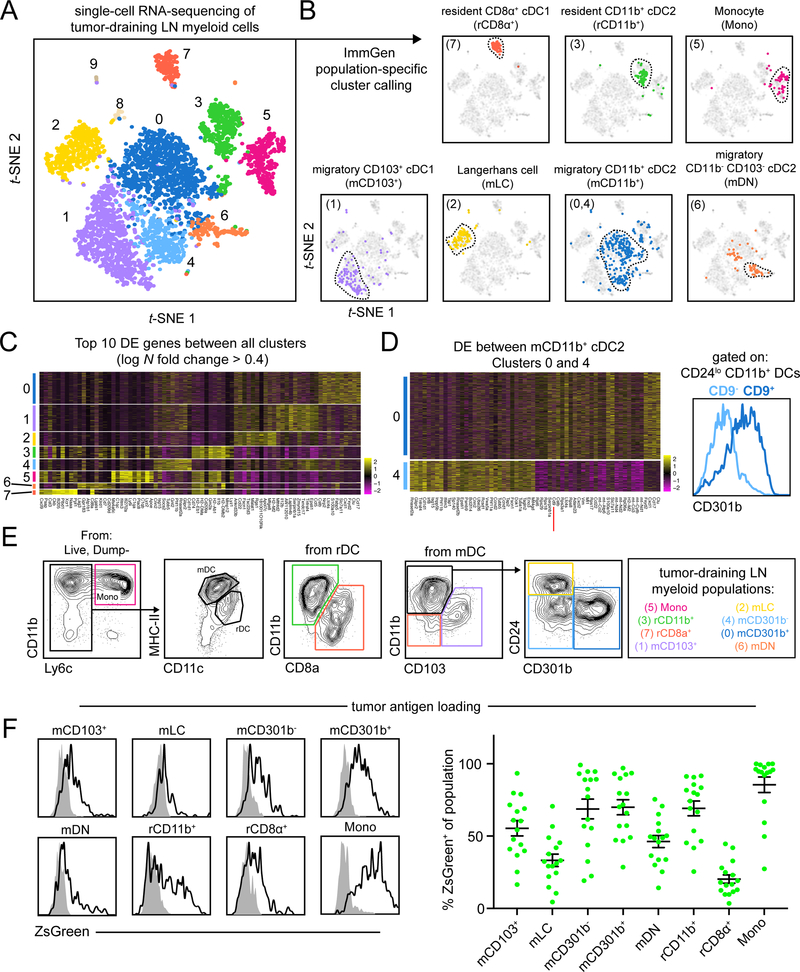
Figure 1.
Unbiased scRNA-seq of myeloid cells in the tdLN reveals extensive heterogeneity.
(A) t-SNE display and graph-based clustering of CD90.2− B220− NK1.1− CD11b+ and/or CD11c+ myeloid cells sorted from B16F10 tdLN and processed for scRNA-seq. Each dot represents a single cell. (B) Expression of ImmGen population-specific gene signatures distributed across t-SNE plot of (A). (C) Heatmap displaying top 10 DE genes for each cluster when comparing clusters 0 through 7 (ranked by fold change) (D) (left) A heatmap displaying the top 30 DE genes between clusters 0 and 4, with Cd9 highlighted by a red line. (right) A flow cytometry histogram displaying the differential surface expression of CD301b between CD9− and CD9+ CD11b+ CD24− DCs (E) Representative gating strategy used to identify myeloid populations in the tdLN (F) Representative flow cytometry histograms displaying levels of ZsGreen tumor antigen within myeloid populations in the tdLN (left). Frequency of ZsGreen+ cells within t dLN myeloid populations (right). Data pooled from two independent experiments. Figure 2

