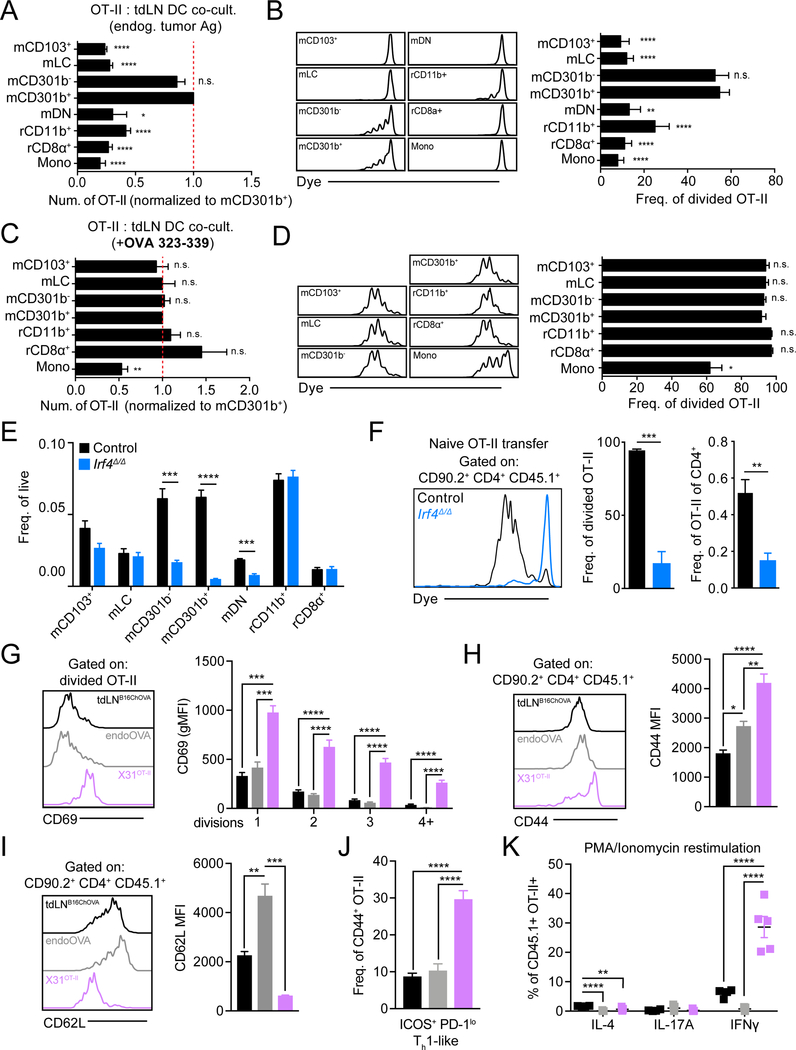
Figure 2.
mCD301b−/+ cDC2 are uniquely able to induce anti-tumor CD4+ Tconv proliferation but fail to initiate CD4+ Tconv differentiation.
(A-D) Purified CD4+ OT-II T cells were co-cultured ex vivo with sorted APC populations from tdLN and analyzed at 3 days. (A) Absolute number of live OT-II T cells recovered from co-culture, normalized and statistically compared to mCD301b+ condition (t-test). (B) Histograms of OT-II T cell dye dilution (left). Frequency of recovered OT-II T cells that had undergone division with statistical comparison to mCD301b+ condition (t-test) (right). (C) Absolute number of live OT-II T cells recovered from co-culture containing exogenous OVA peptide (323–339), normalized and statistically compared to mCD301b+ condition (t-test). (D) Histograms of OT-II T cell dye dilution (left). Frequency of recovered OT-II T cells that had undergone division with statistical comparison to mCD301b+ condition (t-test) (right). (E) Frequency of tdLN DC populations in control or Irf4−/− tumor-bearing mice. (F) Purified CD45.1+ OT-II T cells were adoptively transferred to control or Irf4−/− B16ChOVA tumor-bearing mice with tdLN harvested 3 days later to assess OT-II T cell dye dilution (left) and quantify the frequency of cells that had divided (middle) and their frequency of endogenous CD4+ T cells (right). (G-K) CD45.1+ CD4+ OT-II T cells were transferred to wild-type mice that were inoculated with B16chOVA (tdLNB16ChOVA), endoOVA, or X31pOVA and draining LNs were harvested for analysis. (G) Cell surface Cd69 levels on divided CD45.1+ CD4+ OT-II T cells (left) and quantification of MFI with each cell division as determined by dye dilution (right) 3 days following transfer. Surface CD44 (H) and CD62L (I) levels on transferred CD45.1+ CD4+ OT-II T cells (left) and quantification of MFI (right) 3 days following transfer. (J) Frequency of transferred CD45.1+ CD4+ CD44+ OT-II T cells that are ICOS+PD-1lo Th1-like. (K) Frequency of transferred CD45.1+ CD4+ CD44+ OT-II T cells that produce IL-4, IL-17A and IFNγ following PMA/Ionomycin restimulation with detection by intracellular antibody staining 7 days after transfer. Data are represented as average ± SEM unless explicitly specified. *P <0.05, **P<0.01, ***P<0.001, ****P<0.0001.

