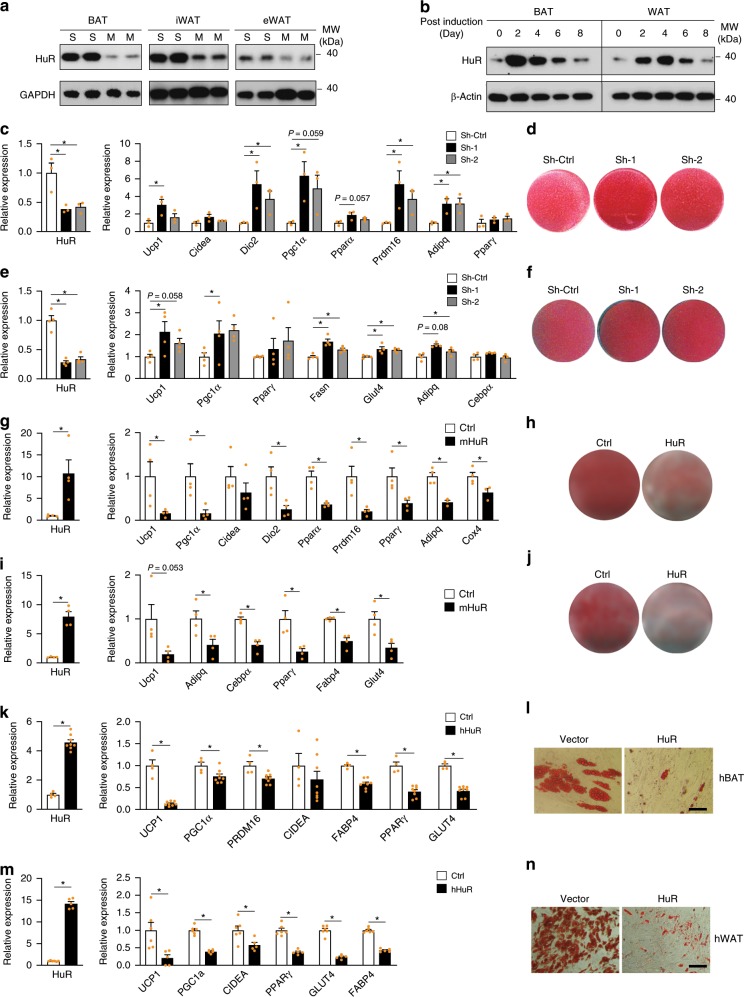
Fig. 1. HuR represses adipocyte differentiation in vitro.
a Western blot to compare the HuR expression in Stromal vascular fraction of adipose tissue (S) and mature adipocytes (M). b Western blot to examine the protein levels of HuR in primary brown and white adipocyte differentiation time course. c Primary brown preadipocytes were infected by retroviral shRNAs targeting HuR followed by induction of differentiation for 5 days. Real-time PCR was used to measure the knockdown efficiency (left), BAT-selective marker and pan-adipocyte marker expression (right). n = 3. d Oil Red O staining to assess lipid accumulation. e, f Similar as in (c, d), but in primary white adipocyte culture. n = 4. g Retroviral overexpression of HuR in primary brown preadipocytes. Real-time PCR was conducted to examine HuR (left) and marker gene expression (right) of brown adipocyte culture expressing HuR or vector at day 5. n = 4 per group. h Oil Red O staining of HuR-overexpressing brown adipocytes. I, j Similar as in (g, h), but in primary white adipocyte culture. n = 4 per group. k Retroviral overexpression of HuR in human fetal brown adipocytes. Real-time PCR was used to determine the expression of HuR (left) and marker gene expression at day 21 post induction (Ctrl, n = 4; HuR, n = 8). l Oil red O staining for human brown adipocytes at day 21 post induction. The scale bar represents 100 μm. m, n similar as (k, l) in Human subcutaneous WAT at day 14 post induction (Ctrl, n = 6; HuR, n = 5). The scale bars represent 100 μm. Error bars are mean ± SEM. Statistical significance using Student’s t-test for (g), (i), (k), and (m), One-way ANOVA test for (c) and (e), *p < 0.05. Source data are provided as a Source Data file.

