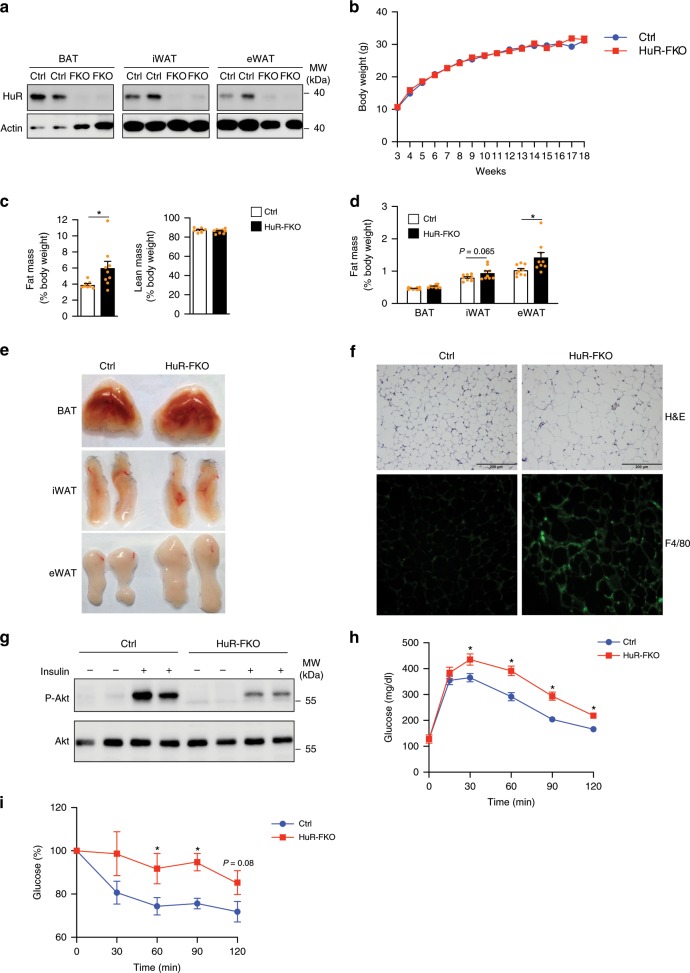
Fig. 2. HuR knockout in adipose tissue results in increased fat mass.
a Western blot analysis of HuR expression in BAT, iWAT, and eWAT of HuR-KFO and control mice. b Body weight of male HuR-FKO and control (HuRflox/flox) mice (Ctrl, n = 7; HuR-FKO, n = 10). c In vivo fat and lean mass by EcoMRI in 3-month-old male HuR-FKO and control littermates. (Ctrl, n = 8; HuR-FKO, n = 9). d The organ weights of BAT, iWAT, and eWAT in 3-month-old HuR-FKO and control littermates were normalized as a percentage of total body weight. n = 9 per group. e Representative picture of BAT, iWAT, and eWAT. f Morphological characteristics of eWAT by H&E staining and immunostaining of eWAT with F4/80. Scale bars represent 200 μM. g Insulin-induced AKT phosphorylation in eWAT from HuR-FKO and Ctrl mice. Five minutes after IP insulin injection, mice were then sacrificed to harvest eWAT and examined its phosphorylation levels of AKT by western blot. h Blood glucose levels during glucose tolerance test (GTT) (n = 9 per group) and i insulin tolerance test (ITT) of HuR-FKO and control littermates (Ctrl, n = 8; HuR-FKO, n = 6). Error bars are mean ± SEM. Statistical significance was determined by Student’s t-test; *p < 0.05. Source data are provided as a Source Data file.

