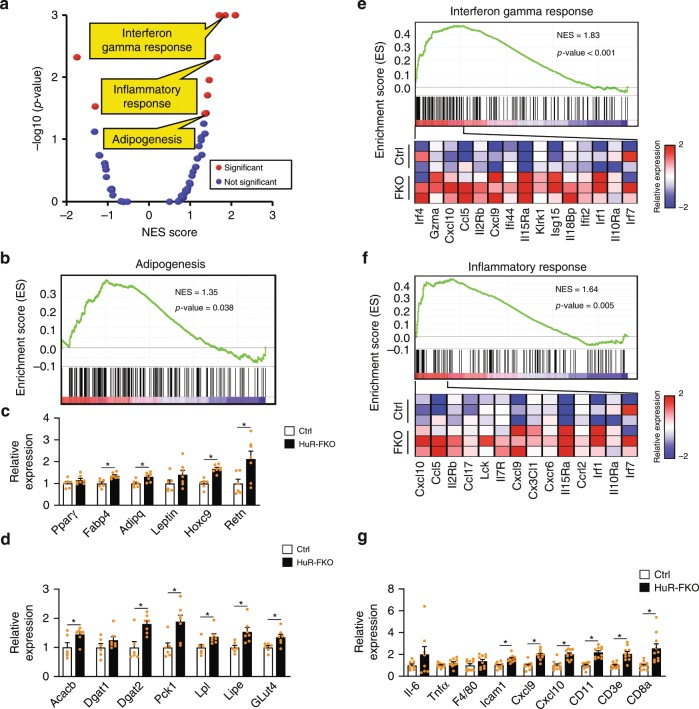
Fig. 3. HuR knockout enhances adipogenesis and inflammation in eWAT.
a GSEA was performed to analyze the pathways affected by HuR depletion in eWAT. Scatterplot depicts the relationship between the p-value and normalized enrichment score (NES) of 50 “Hallmark” gene sets in MSigDB. Significant biological pathways are labeled in red. b GSEA in adipogenesis pathway. c Real-time PCR to confirm the expression of genes for white fat and adipogenesis (Ctrl, n = 6; HuR-FKO, n = 7). d Real-time PCR to confirm the expression of genes for lipogenesis and glucose uptake (Ctrl, n = 6; HuR-FKO, n = 7). e GSEA in interferon gamma response and f inflammatory response pathway. At the bottom of each panel shows a heatmap of representative genes found within the leading edge-subset of the biological pathway. The color intensity represents median centered gene expression (FPKM) with red and blue representing highly and lowly expressed genes, respectively. g Real-time PCR to confirm the expression of genes involved in inflammation. n = 10 per group. Error bars are mean ± SEM. Statistical significance was determined by Student’s t-test; *p < 0.05. Source data are provided as a Source Data file.

