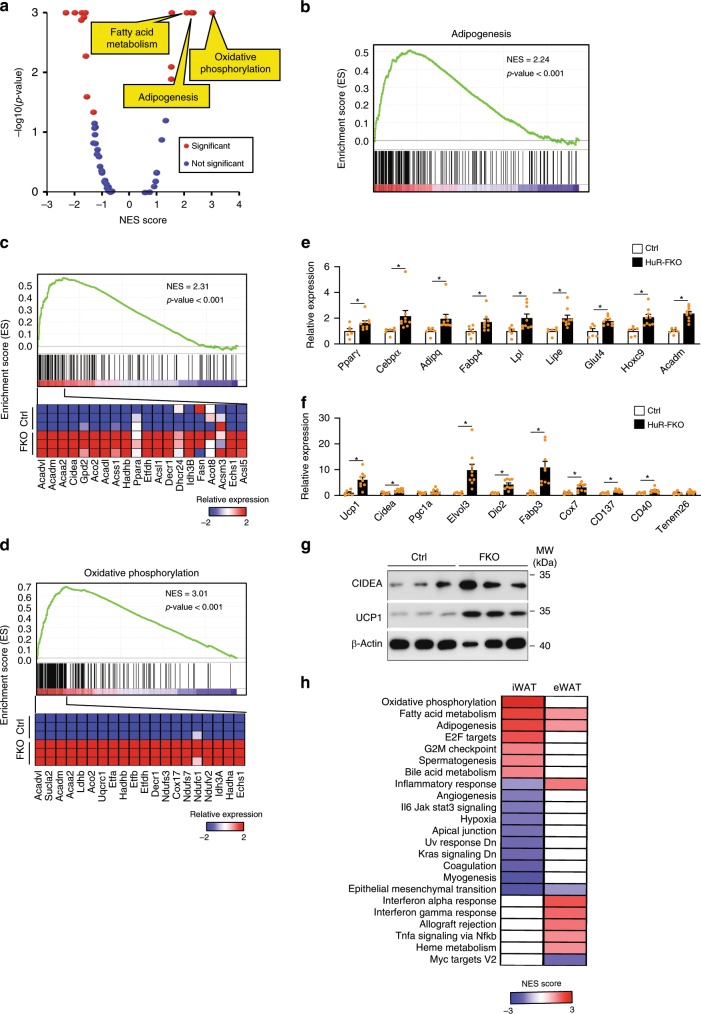
Fig. 4. HuR knockout enhances adipogenesis and browning in iWAT.
a GSEA was performed to analyze the pathways affected by HuR depletion in iWAT. Scatterplot depicts the relationship between the p-value and NES score of 50 “Hallmark” gene sets in MSigDB. b GSEA on the biological pathway of adipogenesis, c fatty acid metabolism, and d oxidative phosphorylation. e Real-time PCR to confirm the expression of genes for adipogenesis, lipogenesis, and f BAT-selective and beige fat markers (Ctrl, n = 6; HuR-FKO, n = 9). g Western blot was performed to examine the protein level of Cidea and Ucp1 in iWAT from HuR-FKO and Ctrl mice. h The regulated pathways in HuR-FKO iWAT and eWAT are displayed in a heatmap. The color represents the NES for each pathway. Error bars are mean ± SEM. Statistical significance was determined by Student’s t-test; *p < 0.05.

