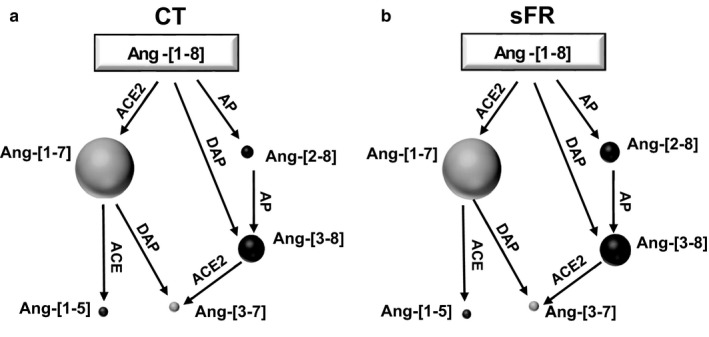
Figure 5.

Representative figure of severe food restricted (sFR) on Ang‐[1‐8] metabolism in the brain stem and hypothalamus. Shown are representations of the relative amounts of Ang‐[1‐8] metabolites depicted by the circle volumes drawn to scale after the addition of Ang‐[1‐8] to hypothalamic homogenates from CT (a) and sFR (b) animals (n = 8/group). ACE, angiotensin converting enzyme; ACE2, angiotensin converting enzyme 2; AP, aminopeptidase; DAP, dipeptidyl aminopeptidase; NEP, neutral endopeptidase
