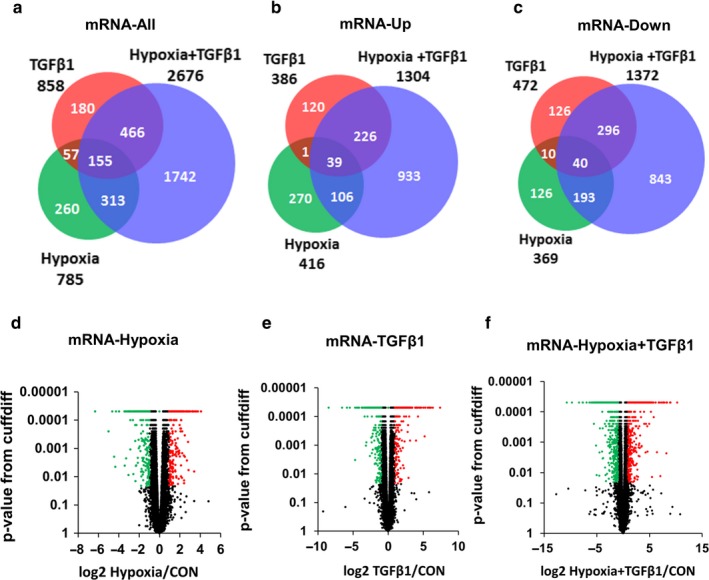
Figure 2.

Hypoxia and TGFβ de‐regulate more mRNAs than hypoxia or TGFβ alone in HPF cells. (a–c) Venn diagrams showing the number of significantly de‐regulated mRNAs in HPFs treated with hypoxia, TGFβ1 and hypoxia + TGFβ1 compared to normoxia. (a) All de‐regulated mRNAs. (b) Upregulated mRNAs. (c) Downregulated mRNAs. (d–f) Volcano plots showing the distribution of de‐regulated mRNAs of HPF treated with hypoxia (d), TGFβ1 (e), and hypoxia + TGFβ1 (f). Red and green dots indicate significantly upregulated and downregulated transcripts, respectively (FDR <0.05 and fold change ≥2). Black dots indicate unchanged (fold change below 2) and non‐significant transcripts (FDR ≥0.05). Con: control
