Figure 3.

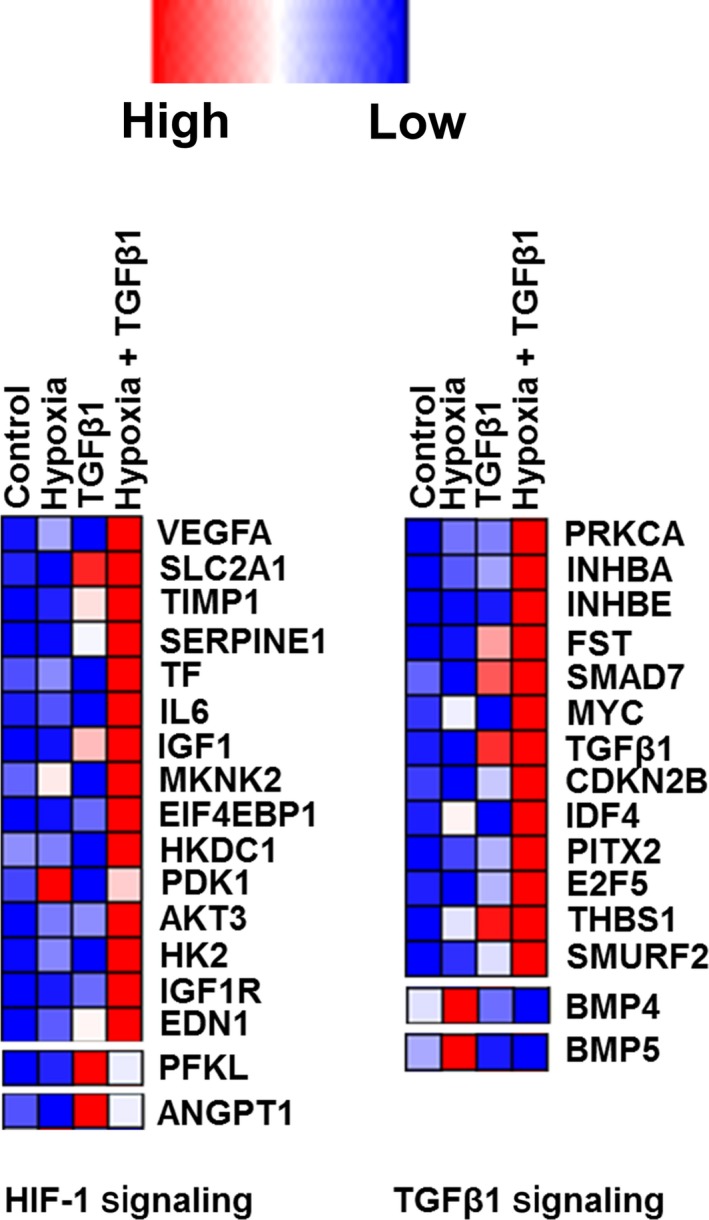
Heat map showing the genes involved in HIF signaling and TGFβ signaling. The color codes from blue to red represent their expression levels from low to high

Heat map showing the genes involved in HIF signaling and TGFβ signaling. The color codes from blue to red represent their expression levels from low to high